
Fair Decathlon Model. Part 3: Forty Seasons, Cleaner Data, and Wider Calibration (13)
Part III: Forty Seasons, Cleaner Data, and Wider Calibration
Rafal Snoch
July 2026
|
Abstract |
1. Why return to a model that already worked?
The first FDM analysis suggested that the official combined-events tables do not assign comparable nominal values to performances of comparable standing within the decathlon population. Several sprinting and jumping events began from very high scoring levels, while the throws and the 1500 metres began much lower. The proposed formulas attempted to preserve the familiar decathlon scale while bringing the ten events into a more balanced relationship.
A promising first result is not the same as a robust model. Three questions remained open:
- Would the conclusions survive the addition of many more seasons?
- Would a stricter selection of complete decathlons materially change the fitted curves?
- Would the model still behave sensibly if the lower calibration anchor were moved from the 75th-ranked athlete to the 140th-ranked athlete?
Richard Crawford's 2018 paper, Are the Decathlon Tables Fair?, added two further reasons to revisit the work. First, Crawford required complete positive results in all ten events. Second, his discussion drew attention to the nine principles described in the 2001 IAAF Combined Events Scoring Tables. Several choices made intuitively in FDM turned out to be closely related to those principles. His work did not end the FDM project; it helped define a stricter next test.
2. From 21 seasons to 40
The expanded study uses the annual world lists published by Decathlon2000.com for 40 seasons: 1985-2019 and 2021-2025. The 2020 season was excluded because pandemic disruption made its international competition structure unrepresentative of the surrounding years.
The underlying forty-season source contained 17,802 listed performances. Each record was audited before use. The principal rules were:
- all ten individual event marks had to be present and positive;
- the reported official total had to agree with the total recalculated from the event marks, allowing a discrepancy of no more than two points unless a documented source adjustment was present;
- hand-timed performances were normalized before scoring. The adjustments were +0.24 seconds in the 100 metres and 110 metres hurdles, and +0.14 seconds in the 400 metres;
- for each athlete in each season, only the best complete performance was retained before the annual ranking was formed.
Table 1. Audit and selection of the forty-season database
|
Stage |
Number |
|
Source records |
17,802 |
|
Incomplete or zero-event records excluded |
508 |
|
Complete records excluded after manual review |
17 |
|
Accepted complete performances |
17,277 |
|
Final calibration sample |
6,000 (40 seasons x 150 athletes) |
Seventeen complete records showed a discrepancy larger than the accepted two-point tolerance between the published and recalculated official totals and contained no documented source adjustment. They remain in the audit file, but were excluded from both the accepted database and the calibration sample.
The calibration sample was then formed from the best complete performance by each athlete, up to 150 athletes per season. This produced exactly 6,000 observations. The stricter procedure improved the methodological quality of the sample, but - as the following sections show - it barely changed the sporting standards extracted from it.
3. Stability of the reference performances
The most direct robustness test is to compare the original 21-season reference performances with the corresponding values from the cleaned forty-season sample. The positions refer to athletes ranked by the complete decathlon total; the event marks are then averaged across the selected seasons.
Table 2. Reference performances: original 21-season sample versus the clean 40-season sample
|
Event |
21 seasons |
40 clean |
21 seasons |
40 clean |
21 seasons |
40 clean |
|
100 m |
10.68 |
10.69 |
11.06 |
11.07 |
11.44 |
11.45 |
|
Long jump |
7.61 m |
7.61 m |
7.19 m |
7.19 m |
6.77 m |
6.78 m |
|
Shot put |
15.49 m |
15.54 m |
13.94 m |
13.92 m |
12.26 m |
12.28 m |
|
High jump |
2.09 m |
2.09 m |
1.97 m |
1.97 m |
1.86 m |
1.86 m |
|
400 m |
47.99 |
48.02 |
49.75 |
49.77 |
51.71 |
51.67 |
|
110 m h |
14.15 |
14.18 |
14.79 |
14.80 |
15.49 |
15.54 |
|
Discus throw |
48.00 m |
48.18 m |
42.16 m |
42.17 m |
36.90 m |
37.04 m |
|
Pole vault |
5.10 m |
5.09 m |
4.66 m |
4.65 m |
4.21 m |
4.21 m |
|
Javelin throw |
65.96 m |
65.82 m |
56.80 m |
56.90 m |
48.83 m |
48.96 m |
|
1500 m |
4:22.73 |
4:22.09 |
4:39.60 |
4:38.90 |
5:00.49 |
5:00.46 |
The stability is visible immediately. Expanding the sample from 21 to 40 seasons and restricting it to complete decathlons changed very few of the reference marks in a meaningful sporting sense. Across all thirty comparisons, the largest changes were 0.05 seconds in the sprint and hurdles events, 0.01 metres in the jumping events, 0.18 metres in the throws, and 0.70 seconds in the 1500 metres. Several values remained exactly unchanged at the displayed precision.
The same stability appears after converting the average marks into official points. The mean reference levels moved by less than one point per event.
Table 3. Mean official point level of the three reference positions
|
Reference position |
Original 21 seasons |
Clean 40 seasons |
Change |
|
10th |
885.0 |
885.9 |
+0.9 |
|
75th |
779.0 |
779.4 |
+0.4 |
|
140th |
676.0 |
676.7 |
+0.7 |
|
Interpretation The original 21-season sample did not capture a temporary scoring environment. It identified a stable structure that remained almost unchanged after nearly doubling the number of seasons and applying a stricter complete-performance filter. |
4. What the official tables assign to the reference marks
The overall averages are stable, but the ten events do not contribute equally to them under the official tables. The following table converts the cleaned forty-season mean marks into official points. The mark is averaged first; the resulting mean mark is then entered into the scoring formula.
Table 4. Clean forty-season reference marks and their official point values
|
Event |
10th mark |
OFF pts |
75th mark |
OFF pts |
140th mark |
OFF pts |
|
100 m |
10.69 |
931 |
11.07 |
844 |
11.45 |
764 |
|
Long jump |
7.61 m |
963 |
7.19 m |
858 |
6.78 m |
761 |
|
Shot put |
15.54 m |
823 |
13.92 m |
723 |
12.28 m |
623 |
|
High jump |
2.09 m |
890 |
1.97 m |
779 |
1.86 m |
683 |
|
400 m |
48.02 |
908 |
49.77 |
825 |
51.67 |
739 |
|
110 m hurdles |
14.18 |
951 |
14.80 |
874 |
15.54 |
786 |
|
Discus throw |
48.18 m |
832 |
42.17 m |
709 |
37.04 m |
605 |
|
Pole vault |
5.09 m |
938 |
4.65 m |
804 |
4.21 m |
676 |
|
Javelin throw |
65.82 m |
826 |
56.90 m |
691 |
48.96 m |
573 |
|
1500 m |
4:22.09 |
797 |
4:38.90 |
687 |
5:00.46 |
557 |
|
Mean |
|
885.9 |
|
779.4 |
|
676.7 |
At the 10th-place level, the official values range from 797 points in the 1500 metres to 963 points in the long jump. At the 140th-place level, they range from 557 points in the 1500 metres to 786 points in the hurdles. The official mean is stable; the event distribution around that mean is not.
This distinction is central to FDM. The aim is not to force every athlete to score the same number of points in every event. It is to make representative performances of comparable standing begin from comparable nominal levels, while preserving meaningful differences between stronger and weaker marks.
5. Moving the lower anchor from 75th to 140th
The original FDM used the 10th- and 75th-place performances as fixed anchors. The 140th-place performance was left outside the fitting process as a control. That first control also performed well: the average prediction was very close to the observed 140th-place level, and the event-to-event spread was approximately 30 points.
The forty-season recalibration reverses the role of the two lower positions:
- 10th place remains the upper anchor at 885.9 points per event;
- 140th place becomes the lower anchor at 676.7 points per event;
- 75th place, with an observed mean of 779.4 points, becomes the independent middle control.
This is a stricter structural test. The fitted curves are forced to pass through two levels separated by approximately 209 points per event. The midpoint is not used in the fit. If the curve shape is unsuitable, the independent 75th-place mark should drift away from its expected level.
|
Independent control result |
Figure 1 shows the event-level result. The ten curves were fitted only to the 10th- and 140th-place marks; none of the 75th-place values were used to determine the coefficients.
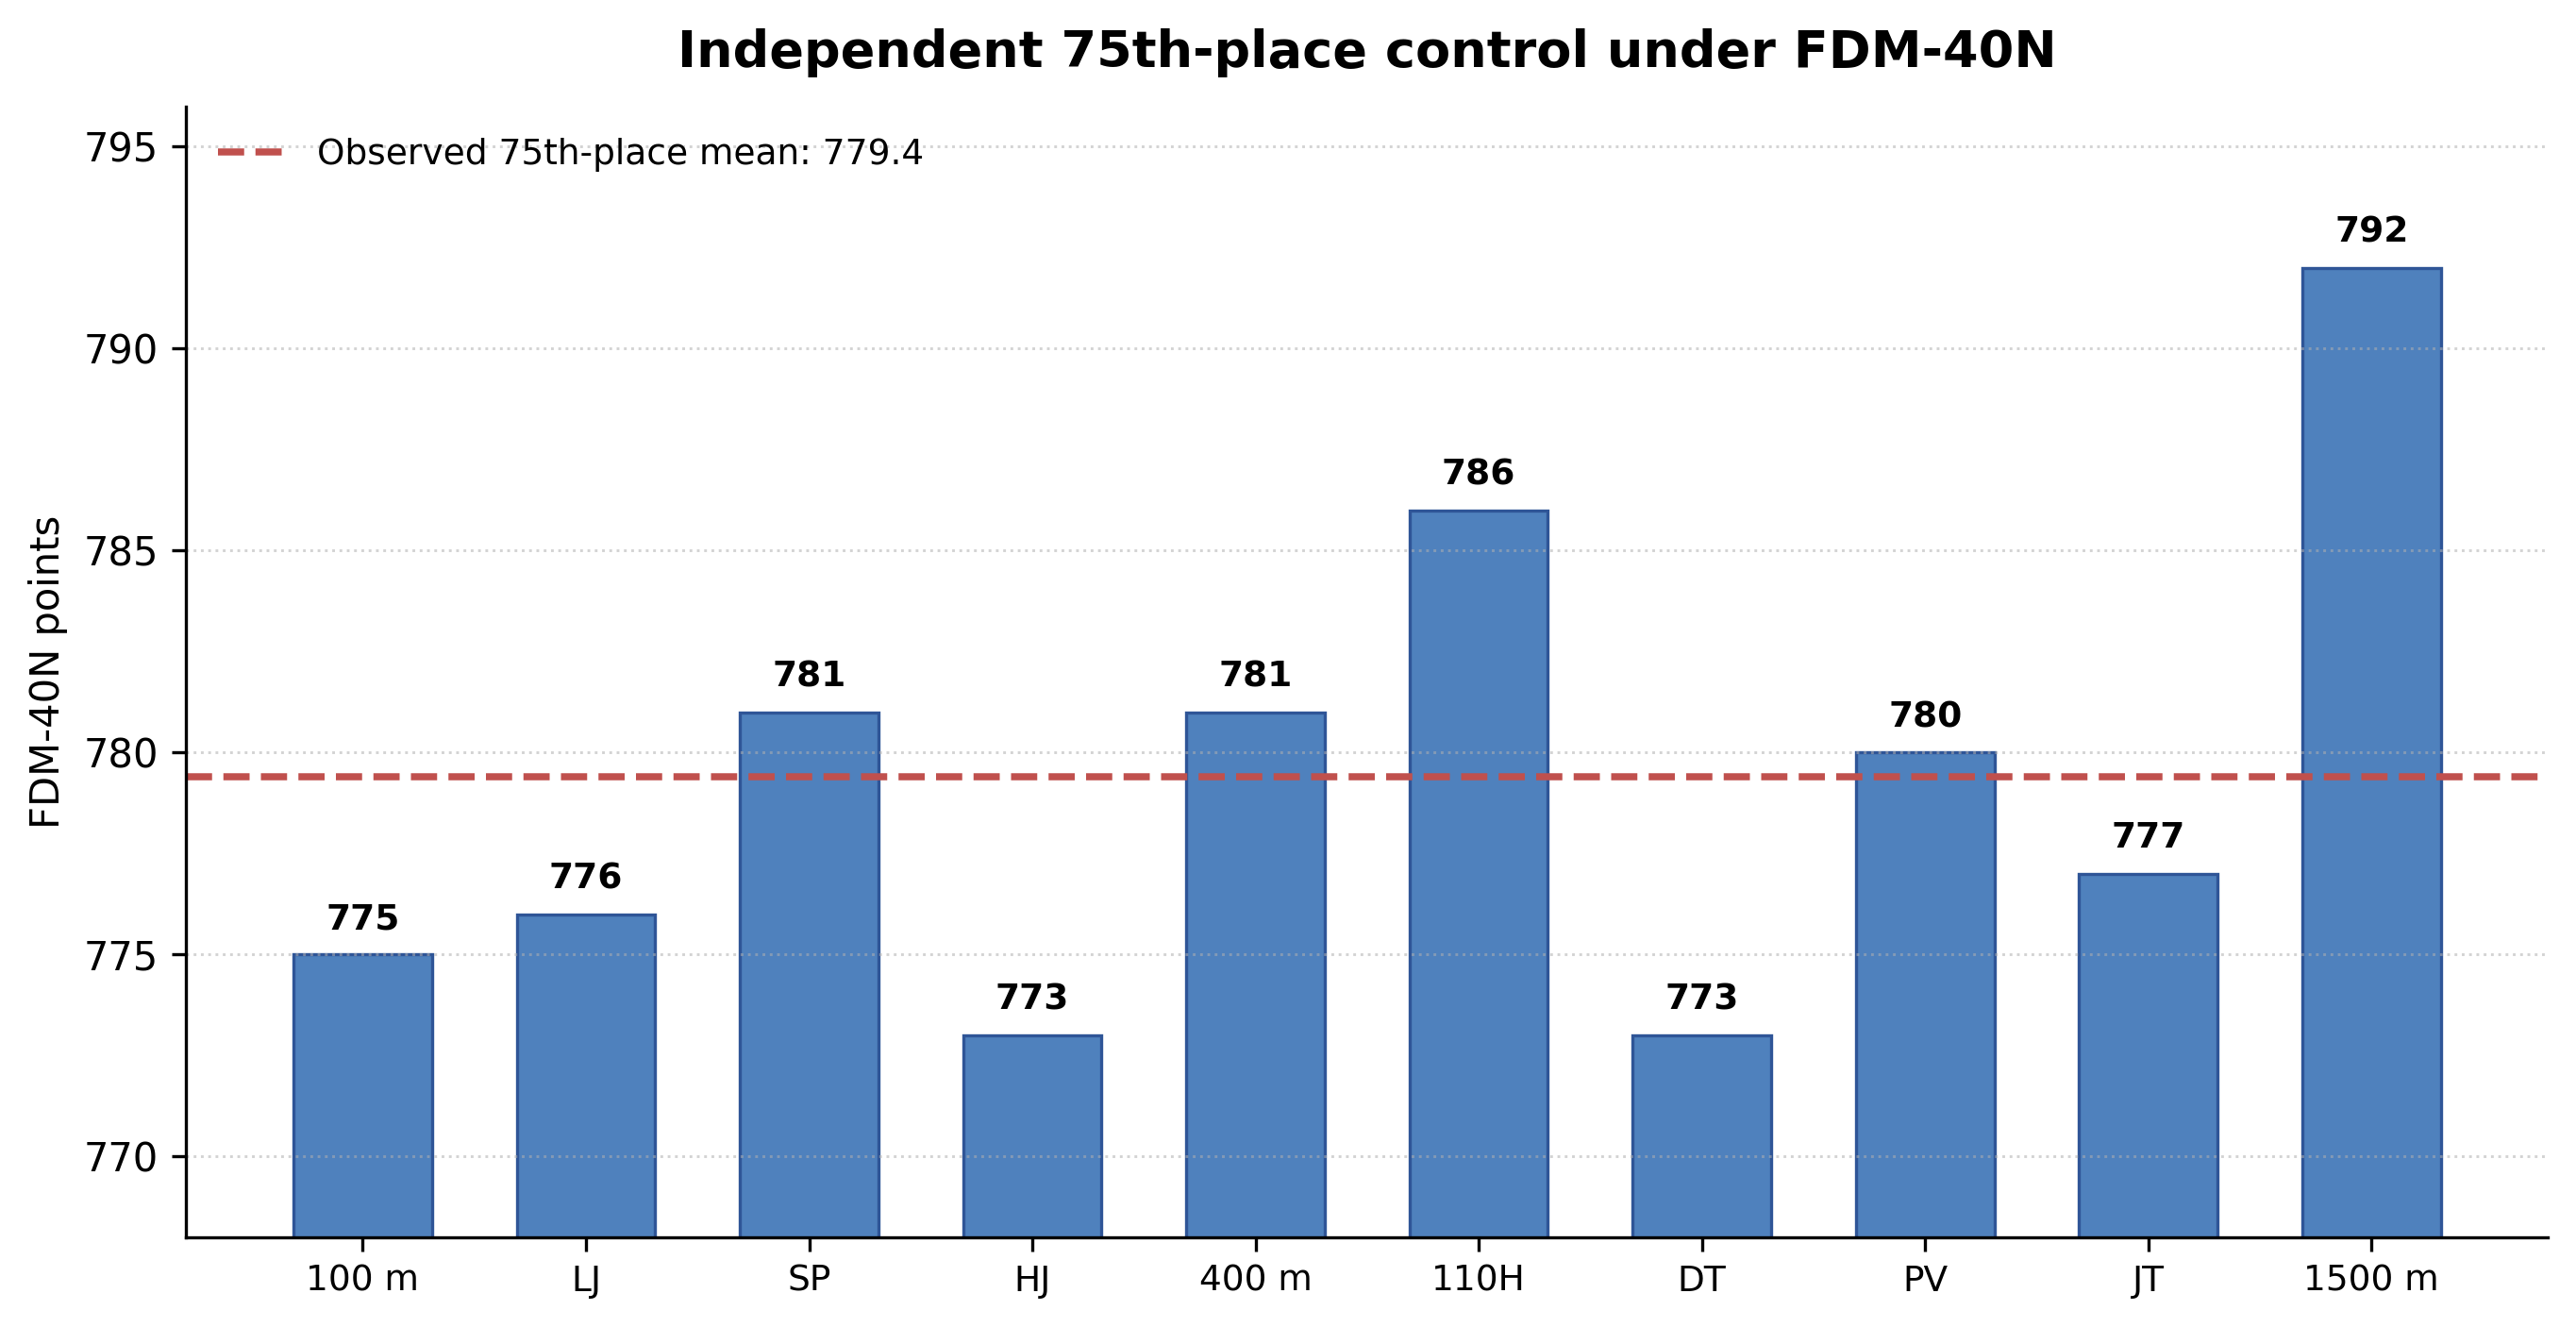
Figure 1. Independent 75th-place control under FDM-40N
The wider calibration therefore confirmed the same sporting relationships across a substantially larger range of high-level decathlon performance.
6. The final forty-season formulas
The scoring functions retain the standard combined-events form. For running events, smaller marks are better; for jumps and throws, larger marks are better:
|
Scoring equations Running events: P = A(B - M)^C, for M < B. |
Two forty-season variants are retained:
- FDM-40N (Natural): the principal model. The exponents are allowed to take the values implied by the data.
- FDM-40C (Constrained): a control model in which every exponent C is forced into the interval 1 < C < 2 recommended in the 2001 IAAF principles by changing B where necessary.
Table 5. FDM-40N coefficients (natural forty-season fit)
|
Event |
A |
B |
C |
|
100 m |
6.572799 |
18.0 |
2.465048 |
|
Long jump |
0.036021 |
220 |
1.606329 |
|
Shot put |
60.046201 |
1.5 |
1.018732 |
|
High jump |
0.750071 |
75 |
1.443526 |
|
400 m |
0.209526 |
82.0 |
2.368137 |
|
110 m hurdles |
0.649225 |
28.5 |
2.712329 |
|
Discus throw |
26.413889 |
4.0 |
0.927282 |
|
Pole vault |
1.125696 |
100 |
1.108810 |
|
Javelin throw |
34.363170 |
7.0 |
0.797549 |
|
1500 m |
0.496015 |
480 |
1.390723 |
Table 6. FDM-40C coefficients (constrained forty-season fit)
| Event | A | B | C |
| 100 m† | 26.936998 | 16.6 | 1.966076 |
| Long jump | 0.036021 | 220 | 1.606329 |
| Shot put | 60.046201 | 1.5 | 1.018732 |
| High jump | 0.750071 | 75 | 1.443526 |
| 400 m† | 1.058362 | 77.0 | 1.999011 |
| 110 m hurdles† | 7.805455 | 24.9 | 1.995050 |
| Discus throw‡ | 18.755654 | 1.0 | 1.000317 |
| Pole vault | 1.125696 | 100 | 1.108810 |
| Javelin throw‡ | 11.980302 | -6.0 | 1.006822 |
| 1500 m | 0.496015 | 480 | 1.390723 |
† Blue rows: the natural exponent was above 2 and was constrained downward by changing B. ‡ Red rows: the natural exponent was below 1 and was constrained upward. Unshaded rows are identical to FDM-40N.
Only five events differ between the two forty-season variants: the 100 metres, 400 metres, 110 metres hurdles, discus and javelin. The other five functions are identical by construction.
Figure 2 visualises both directions of the constrained adjustment. The shaded bands mark the range between the 10th- and 140th-place reference performances. Within that calibrated range, FDM-40C remains very close to FDM-40N despite the altered B and C values. The visible cost of the constraint is displaced toward weaker performances, most clearly in the lower part of the javelin curve.
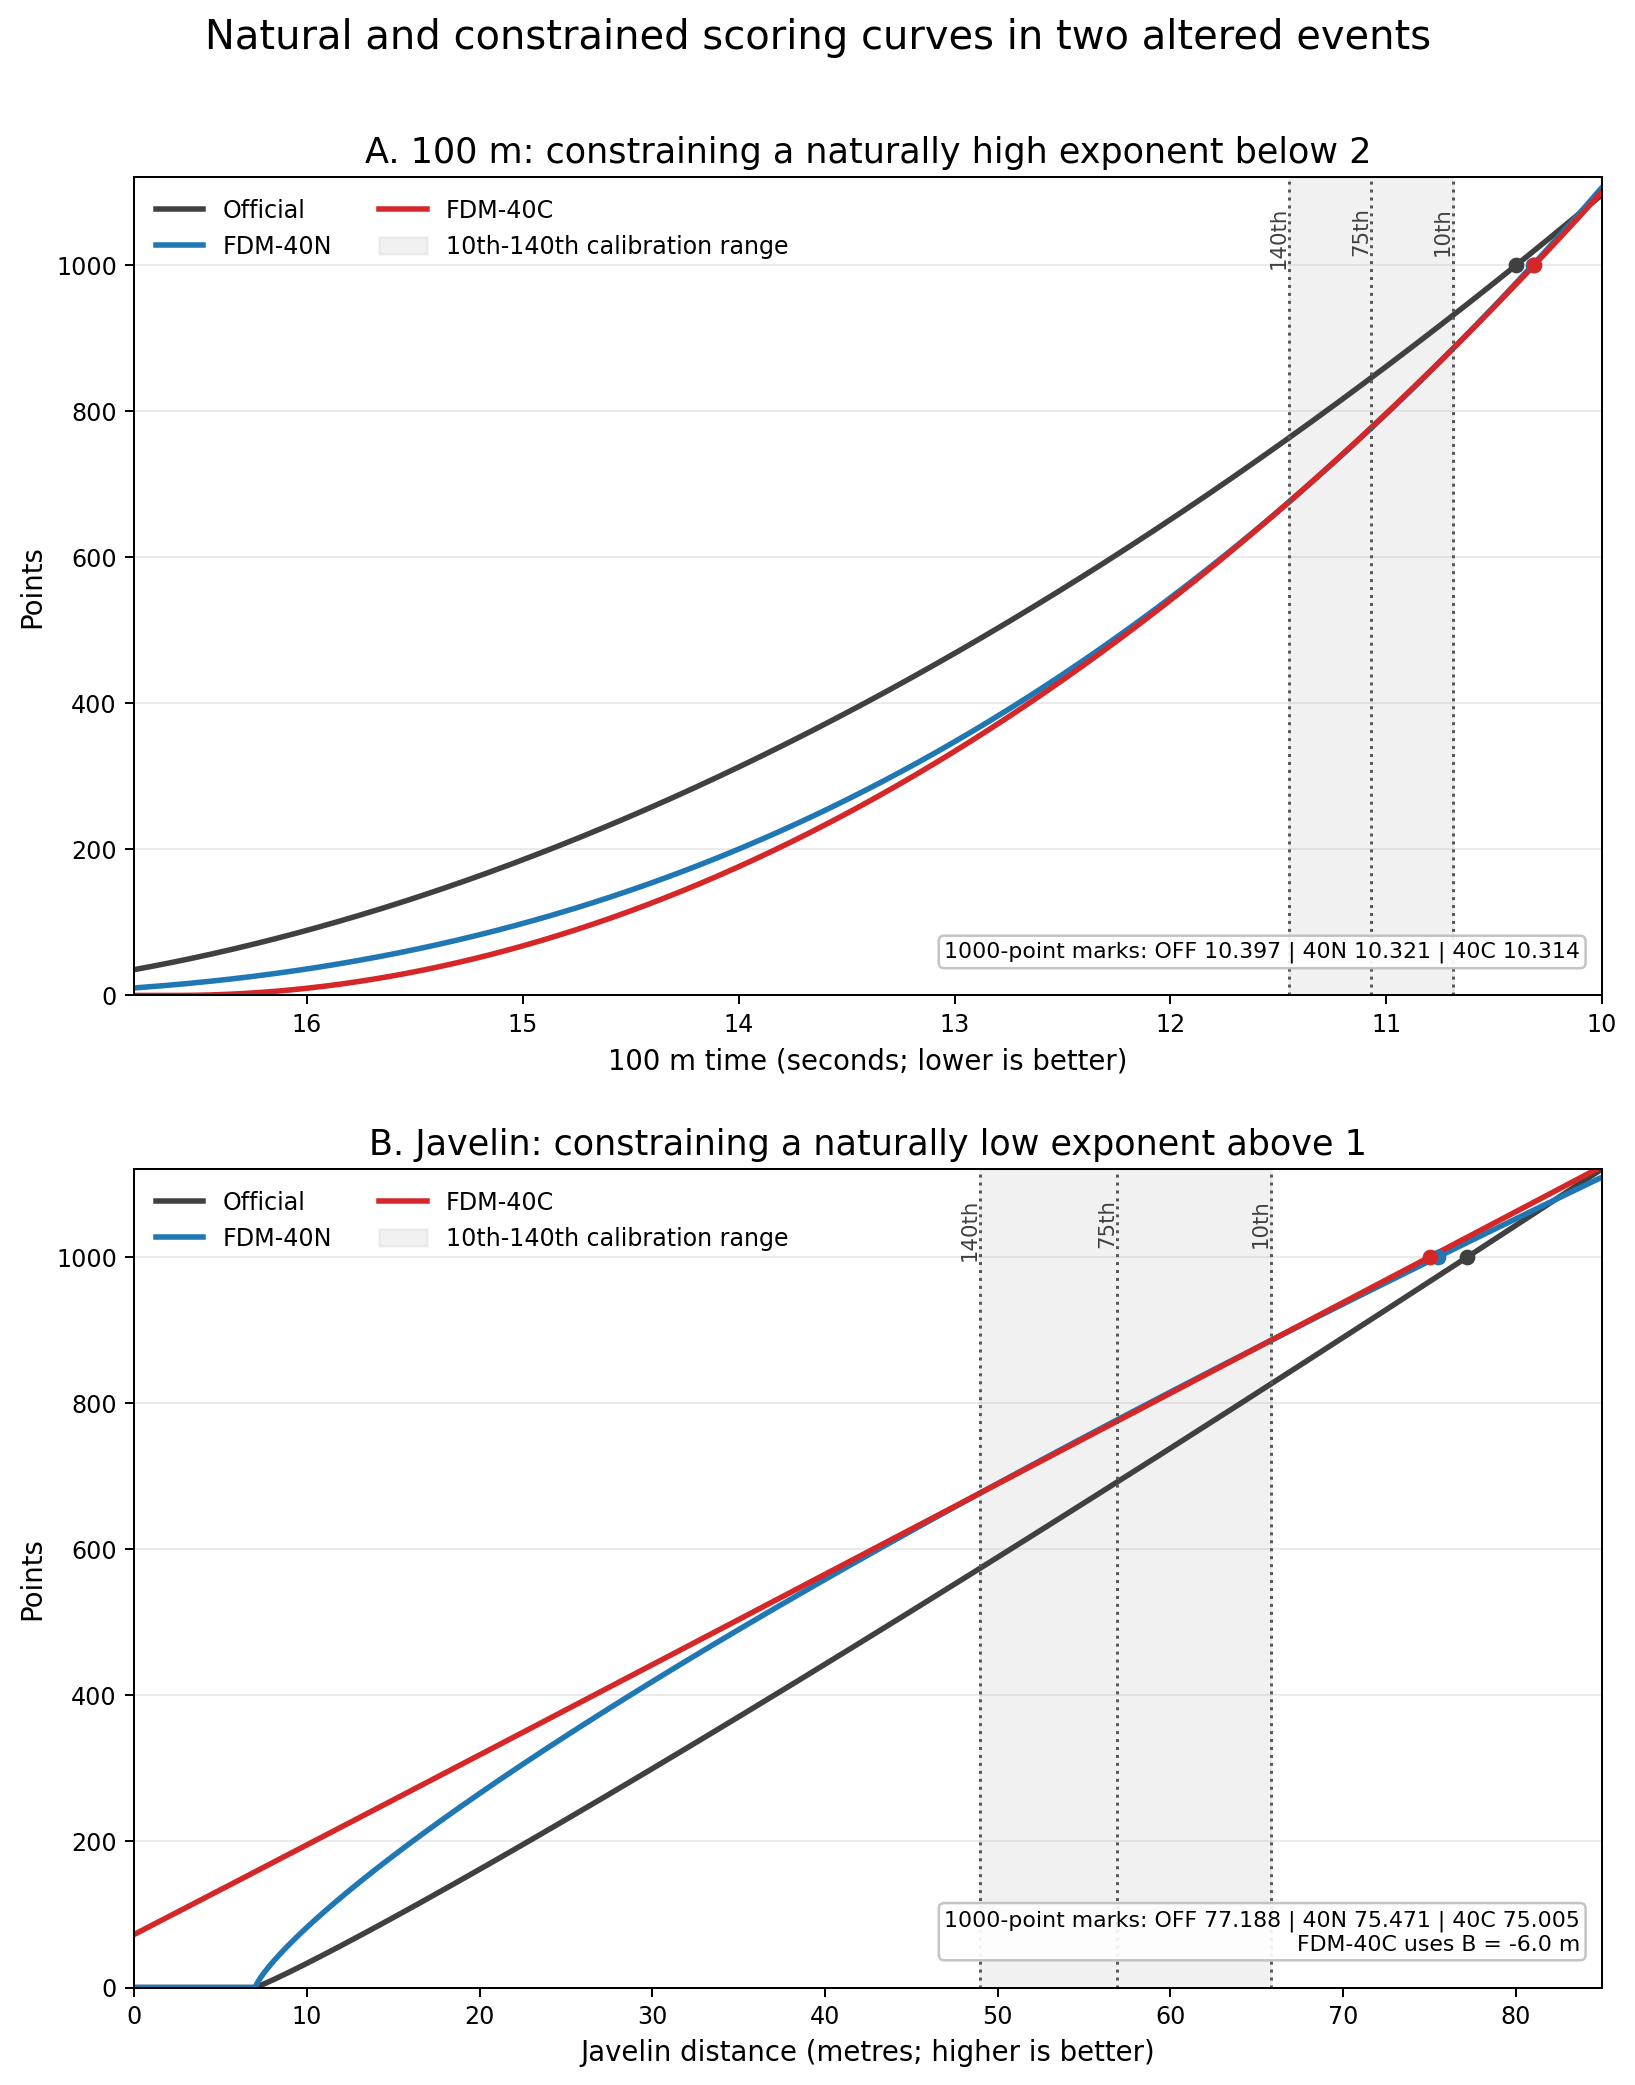
Figure 2. Natural and constrained scoring curves for the 100 metres (A) and javelin throw (B). The shaded bands show the 10th-140th calibration range; the circular markers indicate the continuous 1,000-point performances.
7. What does a 1,000-point performance mean?
The coefficients A, B and C describe the mathematical structure of each scoring curve, but they are not especially intuitive for most readers. A more accessible comparison is to ask what performance is worth exactly 1,000 points in each event.
The values below are continuous solutions of the scoring equations for P = 1000 (that is, before integer truncation). They are shown to three decimal places to compare the curves cleanly. Actual competition marks are recorded at the standard event precision, and the calculated points are then truncated. The table should therefore be read as a structural comparison, not as a list of the first officially recordable marks awarding 1,000 points.
Table 7. Continuous performance corresponding to exactly 1,000 points
|
Event |
Official tables |
FDM-40N |
Change from OFF |
FDM-40C |
|
100 m |
10.397 s |
10.321 s |
0.076 s faster |
10.314 s |
|
Long jump |
7.759 m |
8.037 m |
0.278 m farther |
8.037 m |
|
Shot put |
18.394 m |
17.314 m |
1.080 m less |
17.314 m |
|
High jump |
2.208 m |
2.211 m |
0.003 m higher |
2.211 m |
|
400 m |
46.173 s |
46.236 s |
0.063 s slower |
46.209 s |
|
110 m hurdles |
13.808 s |
13.530 s |
0.278 s faster |
13.513 s |
|
Discus throw |
56.160 m |
54.342 m |
1.818 m less |
54.250 m |
|
Pole vault |
5.286 m |
5.563 m |
0.277 m higher |
5.563 m |
|
Javelin throw |
77.188 m |
75.471 m |
1.717 m less |
75.005 m |
|
1500 m |
3:53.798 |
4:02.258 |
8.460 s slower |
4:02.258 |
The table translates the same structure already visible in the forty-season checkpoints. Under the official tables, 1,000 points are reached comparatively easily in the long jump, pole vault and hurdles. FDM requires approximately 28 centimetres more in both the long jump and pole vault, and approximately 0.28 seconds faster in the hurdles.
The opposite pattern appears in the throws. Relative to the official tables, FDM-40N reaches 1,000 points with approximately 1.08 metres less in the shot put, 1.82 metres less in the discus and 1.72 metres less in the javelin. These changes are consistent with the low official point values assigned to representative throwing performances in Table 4.
The high jump and 400 metres are notable exceptions. Their 1,000-point performances are almost unchanged. A high jump of approximately 2.21 metres and a 400-metre time of approximately 46.2 seconds occupy nearly the same position under all three systems. FDM is therefore not a mechanical transfer of points from every run and jump to every throw; each curve responds to the observed structure of its event.
The largest change in a running event appears in the 1500 metres: approximately 3:53.8 under the official tables and 4:02.3 under FDM. This is consistent with the very low official point level of representative decathlon 1500-metre performances. It should still be interpreted cautiously, because the final event is unusually sensitive to fatigue, tactical requirements and the standings after nine events.
8. Did the recalibration change the elite conclusions?
A larger sample and new anchors are valuable only if their practical consequences are understood. The clearest test is to return to three elite performances discussed in the original FDM work.
Table 8. Elite case studies under the official tables and successive FDM versions
|
Athlete |
OFF |
Original FDM |
FDM-40N |
FDM-40C |
|
9126 |
9098 |
9109 |
9110 |
|
|
9045 |
9150 |
9144 |
9135 |
|
|
9018 |
9122 |
9133 |
9125 |
The practical interpretation remains stable. Mayer stays close to his official total, while Eaton and Warner continue to gain approximately one hundred points. The differences between the original FDM and FDM-40N are only 6-11 points, despite the larger historical sample, the wider calibration anchors and the stricter selection procedure.
FDM-40C also remains close. The constrained version is not identical to the natural model, but at elite marks the two sets of curves occupy almost the same region. Additional checks, not reproduced here, using composite best decathlon marks and open-event world-record profiles produced the same broad conclusion: cleaning and expanding the database strengthened the method without rewriting the sporting story.
9. What FDM-40C actually tests
The principal model is FDM-40N. FDM-40C is a control experiment designed to answer a specific question: is the recommended progressive interval 1 < C < 2 necessary to reproduce the same upper-level balance?
In the tested range, the answer appears to be no. The natural and constrained versions produce nearly identical elite thresholds, athlete totals and intermediate controls. However, the similarity is achieved by changing the zero thresholds. As Figure 2 shows, this cost is almost invisible within the calibrated range and becomes progressively more important toward the lower end of the scale.
|
The javelin example FDM-40N uses B = 7.0 m and C = 0.797549. FDM-40C forces C just above one, but only by moving B to -6.0 m. At elite javelin distances the two curves remain close. Near the bottom of the scale, however, the negative B means that extremely short valid throws can still receive positive points. A failed or unmeasured attempt remains zero; the issue concerns very short valid marks. |
A negative B is not mathematically invalid and is not explicitly prohibited by the IAAF principles. It is nevertheless counterintuitive because the mathematical zero threshold lies below zero metres, so every extremely short valid throw still receives points. This raises a direct question about the principle that the tables should remain applicable to beginners, juniors and elite athletes alike. The example also illustrates a broader caution: restricting one parameter may simply transfer unusual behaviour to another. FDM-40C is therefore retained as a control model rather than the primary proposal, and its lower thresholds require external testing.
10. Relation to Richard Crawford's work
Crawford's analysis and FDM have more common ground than a simple opposition between two conclusions would suggest. Crawford explicitly observed that the throwing-event medians are low under the official tables. His formal definition of fairness, however, focuses on the point difference associated with movement between percentiles after each event distribution has been centred on its median. In that framework, discus and javelin can have low nominal medians while still showing relatively reasonable internal spreads.
FDM asks an additional question. It treats both the nominal scoring level of representative performances and the value of performance differences as components of event balance. The approaches are therefore related, but not interchangeable.
Crawford's paper contributed directly to the present study in three ways:
- it motivated the strict requirement for ten positive event marks;
- it drew attention to the nine principles in the 2001 IAAF tables;
- it demonstrated the importance of testing the lower levels of the decathlon population rather than assuming that an elite calibration will remain valid indefinitely.
His 2018 research used 63,576 complete decathlons after filtering, ranging from 1,329 to 9,045 points. That population is especially valuable because the present Decathlon2000 world-list database begins at 6,800 official points. The forty-season study can establish historical stability and widen the calibration, but it cannot by itself complete the lower-level validation.
11. Limitations and next steps
The conclusions of this article should be kept within their proper scope. FDM-40N and FDM-40C are strongly supported across the high-level range represented by the 10th, 75th and 140th positions, and their elite consequences are stable. The annual world-list source begins at approximately 6,800 official points. This does not undermine the Top 150 calibration itself, but it prevents the present study from demonstrating that the same curves remain equally well balanced among 4,000-6,800-point decathletes.
The next stages are therefore deliberately separated:
1. A leave-one-event-out validation on the 17,277 accepted complete performances, with the strongest unbiased evidence beginning at approximately the 7,500-point level.
2. A lower-level external test using a population that is not truncated at 6,800 points.
3. A direct comparison of FDM-40N and FDM-40C near their different zero thresholds, especially in the 100 metres, 400 metres, hurdles, discus and javelin.
The coefficients published here should remain frozen before that lower-level test. The purpose of the next stage is not to tune the model until it passes, but to discover honestly where it succeeds, where it weakens and whether any lower-level problem can be corrected without sacrificing the balance already observed higher on the scale.
12. Conclusion
The forty-season recalibration produced a result that is methodologically important precisely because it is not revolutionary.
The reference performances from the original 21-season sample remained remarkably stable after the database was expanded to 40 seasons and restricted to complete decathlons. Moving the lower anchor from 75th to 140th place widened the fitted range, yet the independent 75th-place control was reproduced with high accuracy. The final natural formulas, FDM-40N, preserve the original elite conclusions. The constrained FDM-40C variant shows that similar upper-level behaviour can be reproduced with 1 < C < 2, but only at the cost of more unusual zero thresholds.
The original FDM therefore appears not to have been a fragile product of a narrow sample. It captured a stable relationship among decathlon performances that survived more seasons, stricter data cleaning and a wider calibration. The unresolved question is no longer whether the first model worked in the population from which it was built. The unresolved question is how far down the decathlon scale that structure continues to hold.
|
Principal finding |
References
Crawford, Richard (2018). Are the Decathlon Tables Fair? Research manuscript dated 3 June 2018, hosted by Decathlon2000.com.
IAAF (2001). Scoring Tables for Combined Events. 2001 edition.
Decathlon2000.com. Annual men's decathlon world lists, seasons 1985-2019 and 2021-2025. Accessed July 2026.
Salmistu, Janek (2026). A New Perspective on Decathlon Scoring: Richard Crawford's 2018 Research. Decathlon2000.com.
Snoch, Rafal (2026). Fair Decathlon Model, Parts I-II. Decathlon2000.com.