
Fair Decathlon Model. Part 7: Can Decathlon Calibrate Itself? (0)
FAIR DECATHLON MODEL
PART VII
Can Decathlon Calibrate Itself?
27,741 complete performances | Two population-rank experiments
|
Principal finding Individual lower-level decathletes can become increasingly uneven while the ten event distributions remain remarkably coherent. Two anchors placed deep inside the full population recover a common ten-event scale across most unused percentile positions, and a second model calibrated only from complete decathlons below 7000 OFF preserves the same broad geometry far outside its calibration range. |
Rafał Snoch
for Decathlon2000.com - August 2026
Jagged athletes, stable events?
Part VI showed that the lower we go, the less a decathlete resembles a neat ten-event average. Individual profiles become jagged, uneven and sometimes extreme. But does that mean the decathlon itself becomes equally uneven? Or can a chaotic population of athletes still produce remarkably stable event distributions?
That distinction matters. The residuals examined in Parts V and VI were properties of complete athlete profiles: one event was compared with the level implied by the other nine. This article turns the lens around. Instead of asking whether one athlete is balanced, it asks whether the ten event distributions are balanced when thousands of complete performances are allowed to speak at once.
The question is deliberately structural. If the scoring relationships are real, they should not depend on one narrow slice of the sport. A model calibrated from very different parts of the population should still recover broadly compatible relationships between sprinting, jumping, throwing, hurdling and endurance.
If the decathlon is supposed to belong to everyone, why calibrate the model only from the front of the field?
1. Let the whole master into the room
The unified master now contains 27,741 complete competition records with ten valid raw performances. "Everyone" in this article means everyone currently recovered into that master, not every decathlon ever contested. Coverage is broad but not geographically or historically complete, and the counting unit is a performance rather than a unique athlete.
For FDM-ALL, each event is sorted independently from best to worst. Running events are ordered by lower time; field events by greater height or distance. This means that the ten distributions are treated separately rather than as reconstructed ten-event profiles. The athlete who occupies a particular rank in the 100 metres has nothing to do with the athlete who occupies the same rank in the long jump.
But perhaps that is still too comfortable. What happens if the anchors themselves are moved far below the elite?
The calibration anchors are placed at P50 and P80 of each event distribution. P50 means the 50th percentile: half of the marks are better and half are worse. P80 is the 80th percentile: 80% of the marks are better and 20% are worse. In the 27,741-record master, these correspond to ranks 13,871 and 22,193. No interpolation is used in the rank selection. High jump and pole vault receive one additional safeguard: when a chosen rank falls on a bar-height boundary, the marks at r-1, r and r+1 are averaged and rounded to the practical 0.01 m. Neither anchor required smoothing in this case.
Each of the twenty anchor marks is first converted with the continuous official scoring equation. The mean official point value across the ten P50 marks becomes one common target, and the mean across the ten P80 marks becomes the second. The official zero-point boundary is retained unchanged in every event. Only A and C are solved.
|
Event |
P50 mark |
P80 mark |
|
100 m |
11.36 s |
11.75 s |
|
Long jump |
6.77 m |
6.27 m |
|
Shot put |
12.25 m |
10.58 m |
|
High jump |
1.89 m |
1.77 m |
|
400 m |
51.27 s |
53.47 s |
|
110 m hurdles |
15.51 s |
16.54 s |
|
Discus throw |
36.79 m |
30.81 m |
|
Pole vault |
4.20 m |
3.70 m |
|
Javelin throw |
50.01 m |
41.70 m |
|
1500 m |
4:48.01 |
5:05.63 |
Table 1. FDM-ALL anchor marks. P50 = rank 13,871; P80 = rank 22,193. Common continuous OFF targets: 691.1644 and 581.9133 points per event.
For each event, the two anchor targets are then used to solve the scoring equation for A and C. No additional constraint is imposed on the shape of the curve.
|
Event |
FDM-ALL A |
FDM-ALL C |
|
100 m |
3.181201 |
2.842473 |
|
Long jump |
0.077599 |
1.484905 |
|
Shot put |
61.443044 |
1.019100 |
|
High jump |
0.454705 |
1.546912 |
|
400 m |
0.247776 |
2.316220 |
|
110 m hurdles |
3.313341 |
2.082701 |
|
Discus throw |
35.022822 |
0.854519 |
|
Pole vault |
2.007349 |
1.012697 |
|
Javelin throw |
33.917867 |
0.801406 |
|
1500 m |
0.057357 |
1.787341 |
Table 2. Frozen natural coefficients of FDM-ALL. The P50 and P80 anchors determine A and C; the official zero-point boundary remains unchanged.
2. The ranks we did not use
A two-point calibration must fit P50 and P80 exactly. That is an identity, not evidence. The evidence comes from percentile positions that were never used to solve the equations. Five were selected in advance: P25, P30 and P65 as checks across the broad interior of the distribution, followed by P90 and P95 in the lower tail.
These are out-of-anchor checks, not out-of-sample tests. The marks still come from the same 27,741-performance master; they simply occupy ranks that played no role in determining A and C. The purpose is therefore to test whether two anchor rows recover the shape of the remaining event distributions, not to claim validation on an independent population.
At each tested percentile, one mark is taken from each of the ten independently sorted event distributions. Those ten marks are converted to points. Their mean defines the common level at that percentile, and the reported RMSE is the between-event RMSE of the ten event scores around that ten-event mean. It is therefore different from the athlete-level LOO residual RMSE used in Parts IV and V.
|
Level |
Rank |
OFF mean |
OFF RMSE |
FDM mean |
FDM RMSE |
Reduction |
|
P25 |
6,935 |
757.94 |
66.62 |
757.68 |
4.51 |
93.2% |
|
P30 |
8,322 |
745.07 |
68.31 |
744.38 |
5.58 |
91.8% |
|
P50* |
13,871 |
691.16 |
73.96 |
691.16 |
0.00 |
100.0% |
|
P65 |
18,032 |
647.12 |
77.82 |
647.12 |
1.98 |
97.5% |
|
P80* |
22,193 |
581.91 |
81.08 |
581.91 |
0.00 |
100.0% |
|
P90 |
24,967 |
485.42 |
82.35 |
485.85 |
22.42 |
72.8% |
|
P95 |
26,354 |
396.09 |
83.88 |
396.50 |
48.90 |
41.7% |
Table 3. FDM-ALL control percentiles. * P50 and P80 are calibration identities; the other rows were not used to solve the model.
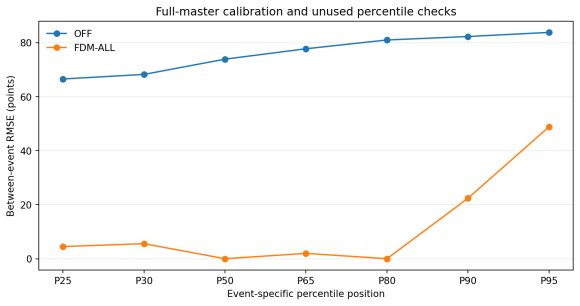
Figure 1. OFF remains widely dispersed at every percentile. FDM-ALL stays extremely compact from P25 through P65, then weakens in the deepest tail.
The interior result is difficult to dismiss as a two-row coincidence. P25, P30 and P65 produce FDM between-event RMSE values of 4.51, 5.58 and 1.98 points. OFF remains between 66.6 and 77.8 points at the same unused positions. Two anchors at the 50th and 80th percentiles therefore recover a common ten-event geometry far above, between and below the anchors.
The pattern changes at P90 and especially P95. FDM RMSE rises to 22.42 and 48.90 points. This is not a uniform drift of all ten events. At P95 the hurdles and pole vault fall most clearly below the common level: 20.11 seconds in the hurdles is worth about 278 FDM-ALL points, and 2.60 m in the pole vault about 343, against a ten-event mean near 397. The deepest tail is beginning to look different from the rest of the distribution.
3. Can lower anchors recover the upper scale?
FDM-ALL was never told what the old 40-season 10th- or 140th-place calibration levels should be. Those reference marks sit well above the P50/P80 anchors, so they provide a useful reference-scale check after the equations have been frozen.
|
Reference row |
FDM-40N target |
FDM-ALL mean |
Difference |
FDM-ALL RMSE |
|
40-season 10th |
885.9 |
884.31 |
-1.59 |
17.51 |
|
40-season 140th |
676.7 |
675.27 |
-1.43 |
23.86 |
Table 4. Upper-scale check using the clean 40-season reference marks. The common scale is recovered closely, although individual event dispersion is larger than inside the P25-P65 range.
The mean scale almost returns by itself: 884.31 points against the 885.9-point 10th-place target, and 675.27 against the 676.7-point 140th-place target. The event-level RMSE values of 17.5 and 23.9 show that this is not a perfect reconstruction of every upper event. Nor should it be treated as one: events such as the 100 m are being extrapolated a long way beyond the lower anchors. The striking part is that the common scale itself survives.
The same is true when the frozen FDM-ALL equations are applied to five famous 9000-point profiles. These athletes were not calibration targets; their totals are a post-freeze elite extrapolation stress test of the upper scale.
|
Athlete |
OFF |
FDM-ALL |
|
Kevin Mayer (2018) |
9126 |
9050 |
|
Ashton Eaton (2015) |
9045 |
9127 |
|
Roman Sebrle (2001) |
9026 |
9030 |
|
Damian Warner (2021) |
9018 |
9090 |
|
Tomas Dvorak (1999) |
8994 |
8983 |
Table 5. Post-freeze elite-profile check for FDM-ALL. The five profiles were evaluated only after the P50/P80 equations had been frozen.
FDM-ALL keeps all five profiles in a recognisable elite scale, but the exact order and reward structure are not identical to OFF or FDM-40N. That is a feature of the test, not a reason to hide it. FDM-ALL is not proposed as a replacement scoring table. It asks whether the decathlon contains enough information in its own event distributions to reconstruct a coherent scale from very different anchor positions.
A sceptic could still object: the giants are not setting the anchors, but they are still in the room. So what happens if we remove them from the room?
4. Remove every 7000+ complete decathlon
The second experiment deliberately restricts the population. FDM-7000- uses 10,720 complete performances with recalculated official totals from 1,314 to 6,999 points. Every record has ten valid raw marks under the project's senior-specification rules. No complete 7000-point performance, let alone a 9000-point profile, is present in the calibration database.
The event distributions are again sorted independently. Two convenient round ranks are chosen: R650, about 6.1% into the lower database, and R3250, about 30.3%. The exact ranks are not treated as sacred constants. Their purpose is simply to place two well-separated anchors inside the stronger half of a deliberately lower-total population and ask what geometry emerges.
|
Event |
R650 mark |
R3250 mark |
|
100 m |
11.11 s |
11.48 s |
|
Long jump |
6.92 m |
6.53 m |
|
Shot put |
12.92 m |
11.47 m |
|
High jump |
1.95 m |
1.84 m |
|
400 m |
50.27 s |
52.04 s |
|
110 m hurdles |
15.15 s |
15.91 s |
|
Discus throw |
39.17 m |
34.01 m |
|
Pole vault |
4.50 m |
4.00 m |
|
Javelin throw |
53.67 m |
46.28 m |
|
1500 m |
4:32.82 |
4:49.13 |
Table 6. FDM-7000- anchor marks. Common continuous OFF targets: 746.7332 and 648.6347 points per event.
The same rules are used as before: continuous official scoring establishes the two common targets, the official zero-point boundary is retained unchanged, and A and C are solved without additional constraints. The resulting coefficients are shown below. Once solved, the functions are frozen before any control rank or elite profile is evaluated.
|
Event |
FDM-7000- A |
FDM-7000- C |
|
100 m |
5.424875 |
2.551571 |
|
Long jump |
0.032094 |
1.633074 |
|
Shot put |
59.723154 |
1.037211 |
|
High jump |
0.672100 |
1.464871 |
|
400 m |
0.154554 |
2.453653 |
|
110 m hurdles |
1.475116 |
2.402829 |
|
Discus throw |
31.673275 |
0.887658 |
|
Pole vault |
3.538357 |
0.913641 |
|
Javelin throw |
32.327516 |
0.816994 |
|
1500 m |
0.078437 |
1.717636 |
Table 7. Frozen natural coefficients of FDM-7000-. The R650 and R3250 anchors determine A and C; the official zero-point boundary remains unchanged.
5. How far down does the lower database stay coherent?
Six ranks were reserved as out-of-anchor checks: R130 and R325 above the upper anchor, R1950 between the anchors, and R5200, R7800 and R10400 below the lower anchor. For high jump and pole vault the r-1/r/r+1 rule is applied at every tested rank. Only R130 pole vault landed on a height boundary; 4.75, 4.75 and 4.73 m were averaged to the practical 4.74 m used in the test.
As in the first experiment, these are internal out-of-anchor shape checks rather than an independent out-of-sample validation. The RMSE reported below again means the between-event RMSE of the ten independently ranked event scores around their ten-event mean.
|
Rank |
Position |
OFF mean |
OFF RMSE |
FDM mean |
FDM RMSE |
Reduction |
FDM spread |
|
R130 |
1.2% |
805.38 |
63.80 |
805.69 |
5.24 |
91.8% |
20.60 |
|
R325 |
3.0% |
773.96 |
66.76 |
774.22 |
2.91 |
95.6% |
10.99 |
|
R650* |
6.1% |
746.73 |
69.98 |
746.73 |
0.00 |
100.0% |
0.00 |
|
R1950 |
18.2% |
687.64 |
75.25 |
687.79 |
1.95 |
97.4% |
7.73 |
|
R3250* |
30.3% |
648.63 |
77.87 |
648.63 |
0.00 |
100.0% |
0.00 |
|
R5200 |
48.5% |
594.38 |
79.74 |
593.79 |
4.53 |
94.3% |
14.45 |
|
R7800 |
72.8% |
496.18 |
79.92 |
494.72 |
25.63 |
67.9% |
89.46 |
|
R10400 |
97.0% |
280.97 |
82.64 |
279.90 |
73.20 |
11.4% |
262.43 |
Table 8. FDM-7000- rank checks. * R650 and R3250 are calibration identities; all other ranks were unused in solving the equations.
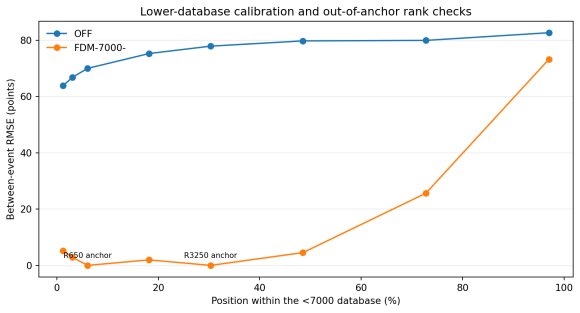
Figure 2. FDM-7000- remains extremely compact through R5200. Clear weakening appears at R7800 and becomes severe only near the bottom of the database.
The first four unused checks are remarkable for their compactness. R130, R325, R1950 and R5200 produce FDM RMSE values of 5.24, 2.91, 1.95 and 4.53 points. R5200 lies almost halfway through a database that contains nothing at 7000 or above, yet the ten independently sorted event marks still collapse onto a common level with a total spread of only 14.45 points.
R7800 is the first clear weakening. FDM RMSE rises to 25.63 points, but the model does not disintegrate uniformly. Nine events remain within about 21 points of the common mean. The 110 m hurdles sit 68.6 points below it. That matters because Part VI already showed that the hurdles develop a strong lower-level population effect: technical difficulty, incomplete profiles and the survival of unusually slow valid races do not affect this event in the same way as a simple horizontal jump or throw.
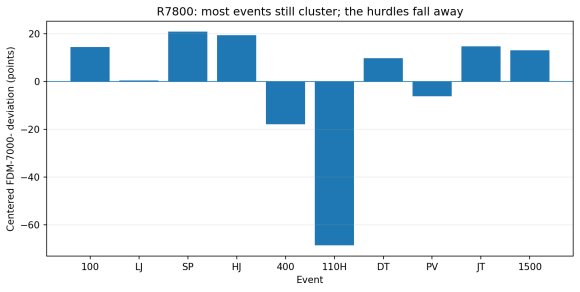
Figure 3. Centered FDM-7000- deviations at R7800. The first substantial loss of compactness is dominated by the hurdles rather than a common ten-event drift.
The full master gives this threshold a useful scale. When the ten R7800 marks are located in the complete 27,741-record distributions, nine of them fall between approximately 89.1% and 89.6% of their respective event distributions. The 1500 m appears slightly earlier, at about 87.3%. In practical terms, the model remains structurally compact through roughly nine-tenths of the observed event-distribution scale before the deepest tail begins to dominate the picture.
R10400 is different. At 97% of the lower database the FDM RMSE reaches 73.20 points. The hurdles are now about 175 points below the ten-event mean, while shot put, high jump and the throws remain relatively high and 400 m falls low. This is no longer a region where a flat ten-event profile should be demanded automatically. Population structure is strong, and several performances are moving toward the low end of their scoring curves.
6. The elite test without the elite
Only after FDM-7000- had been frozen were the same five all-time elite profiles evaluated. The resulting totals form a post-freeze elite extrapolation stress test. A model whose complete calibration profiles stop at 6,999 therefore still reconstructs a familiar 9000-point scale more than two thousand points above the top of its database.
|
Athlete |
OFF |
FDM-7000- |
|
Kevin Mayer (2018) |
9126 |
9088 |
|
Ashton Eaton (2015) |
9045 |
9150 |
|
Roman Sebrle (2001) |
9026 |
9082 |
|
Damian Warner (2021) |
9018 |
9141 |
|
Tomas Dvorak (1999) |
8994 |
9043 |
Table 9. Post-freeze elite-profile check for FDM-7000-. These profiles were evaluated only after the lower-database equations had been frozen.
This does not mean that a 6000-point athlete is a miniature Eaton. FDM-7000- does not extrapolate one lower-level athlete profile into an elite athlete profile. It extrapolates the relative geometry of ten independently observed event distributions. That distinction is the entire point of the experiment.
Nor is the result a claim that these particular coefficients are optimal. Natural exponents vary substantially across events — above 2 in the sprints and hurdles, but below 1 in the discus, javelin and pole vault — making the far ends of the curves sensitive to extrapolation. The result supports the construction method more strongly than it supports FDM-7000- as a final scoring proposal.
7. What did the decathlon tell us?
Part VI showed that individual decathletes become less tidy as the overall level falls. Part VII now adds the complementary result: untidy individuals do not automatically create untidy event distributions. Across most of the available scale, ten very different disciplines preserve a surprisingly stable relationship when they are ranked independently and tied together with only two common-value anchors.
FDM-ALL demonstrates this with the entire 27,741-record master and anchors as low as P50 and P80. FDM-7000- makes the challenge harder by excluding every complete decathlon of 7000 points or more. The internal rank checks remain extremely compact through R5200 and still show a largely coherent nine-event structure at R7800, a level that corresponds to roughly the 89th percentile of the full event distributions.
This is not proof that one immutable mathematical curve governs every decathlete from world record to beginner. The databases contain repeated performances by the same athletes, their geographic coverage is uneven, and event-specific ranks deliberately discard the joint identity of the ten marks. At the deepest levels, a flat profile is not even a reasonable automatic expectation. What the experiments show is narrower and, in my view, more important: the broad geometry of the ten events is not an artefact created only by elite calibration.
|
Conclusion The lower the level, the more uneven individual decathletes can become. Yet the ten event distributions remain coherent across most of the observed scale. The decathlon appears to contain enough information to reconstruct much of its own scoring geometry - even when the complete elite profiles are removed from the calibration population. |
By the time this coherence finally begins to weaken, we are already deep in the lower tail, where Part VI taught us that population structure matters. But population structure may not be the only thing waiting there. Every scoring curve also contains B, the parameter that determines where a performance reaches zero points. If the ten event distributions remain remarkably coherent across most of the scale, yet begin to separate as performances approach those boundaries, then the next question becomes difficult to avoid: how much of the final divergence belongs to the athletes - and how much belongs to B? That is where Part VIII begins.
References and data notes
Snoch, Rafał (2026). Fair Decathlon Model, Parts I-VI. Decathlon2000.com.
Unified FDM master used in this article: 27,741 complete competition records with ten valid raw performances. Lower-total stress-test database: 10,720 complete performances below 7000 recalculated OFF points.
World Athletics / IAAF combined-events scoring equations. Official A, B and C coefficients are used for OFF comparison; FDM calibration calculations use continuous event scores before normal competition-level truncation.