
Fair Decathlon Model. Part 4: Does FDM Balance the Ten Events? (0)
Rafal Snoch
For Decathlon2000 - July 2026
|
Principal finding When athlete level is estimated independently of the event under examination, using the other nine events, the official tables show large and systematic differences between events. In the clean 7500+ range, FDM-40N reduces centred event imbalance by 93.84%, from an RMSE of 78.08 points to 4.81 points. FDM-40C produces almost the same result at 5.06 points. |
1. A different validation question
The previous article tested whether the Fair Decathlon Model remained stable after the calibration database was expanded from 21 to 40 seasons and cleaned more strictly. It did. The reference performances barely moved, the independent 75th-place control was reproduced accurately, and the final natural and constrained formulas produced almost identical results across the calibrated high-level range.
That result established the robustness of the model's construction. It did not yet answer a second and more demanding question: when the level of an athlete is estimated without using the event currently being tested, do the ten events make comparable contributions to the total?
This article addresses that question through a leave-one-event-out (LOO) analysis of 17,277 complete decathlon performances. Each of the ten events is removed in turn. The remaining nine events are used to estimate the athlete's level, and the omitted event is then compared with the value implied by those nine.
The test is deliberately independent of the event under examination. A long-jump score cannot help place an athlete in the long-jump cohort; the athlete's level for that test is defined by the other nine events. The same procedure is repeated for every event and for each scoring model.
2. Database and valid range
The source population is the accepted forty-season Decathlon2000 database described in Part III. It contains 17,277 complete performances with positive marks in all ten events and internally consistent official totals. The LOO expansion produces 172,770 athlete-event observations.
Table 1. Database used in the leave-one-event-out analysis
|
Item |
Value |
|
Complete decathlon performances |
17,277 |
|
Athlete-event observations |
172,770 |
|
Seasons |
1985-2019 and 2021-2025 |
|
Source lower boundary |
Approximately 6,800 official points |
|
Primary pooled range |
7500+ |
|
Diagnostic lower band |
7000-7499 |
The 17,277 records are complete performances, not 17,277 independent athletes. Many athletes appear more than once, so repeated performances are clustered by athlete. This does not change the descriptive event means and centred biases reported below, but it means that naive uncertainty calculations should not treat every performance as independent.
The lower boundary of the source requires care. A performance enters the database only if its official total is approximately 6,800 points or higher. In a leave-one-event-out test, however, the omitted event is removed before level is estimated. Near the source boundary, this creates strong selection pressure: an athlete with a low nine-event level can appear in the database only if the omitted event was sufficiently strong to lift the official total above the inclusion threshold.
For that reason, 7500+ is treated as the primary clean range. The 7000-7499 band is retained only as a diagnostic area, and results below 7000 are not used as evidence of event balance.
3. Leave-one-event-out method
For each athlete, event and scoring model, the calculation proceeds as follows:
Table 2. Core leave-one-event-out quantities
|
Quantity |
Definition |
Interpretation |
|
Nine |
Total - Event |
Points from the other nine events |
|
Expected |
Nine / 9 |
Average point contribution implied by the other nine |
|
Level |
Nine x 10 / 9 |
Ten-event equivalent of the nine-event performance |
|
Residual |
Event - Expected |
How far the tested event lies above or below expectation |
The athlete is then assigned to a performance band using Level. The same raw marks are scored under the official tables, FDM-40N and FDM-40C. The primary comparisons in this article use bands defined by the official LOO level, so that all three models are evaluated on the same athletes.
A positive residual means that the event scored above the average level implied by the other nine events. A negative residual means that it scored below that expectation. Raw residuals are useful, but they contain one common selection effect that must be removed before the ten events are compared.
4. Why the residuals must be centred
LOO selection is asymmetric by construction. Athletes are selected because the other nine events are strong enough to place them in a given level band. The omitted event is not part of that selection. Even in a perfectly balanced system, the mean residual across all ten events will therefore not necessarily be zero.
The relevant comparison is not the absolute mean residual of an event, but its position relative to the common mean residual of all ten events within the same model and band:
Centred event bias = event mean residual - common ten-event mean residual
Centring does not improve any model and does not force every event to zero. It removes only the shared LOO selection shift. What remains is the between-event structure: which events sit high, which sit low, and how far apart they are.
Centred residuals should therefore be interpreted comparatively rather than as pure measurements of scoring error. Even a perfectly designed table would not make every event bias exactly zero, because real decathletes have specialised and biologically uneven profiles. The relevant question is whether one scoring model leaves a smaller systematic between-event structure than another when both are tested on the same athletes.
5. Headline result: 78 points versus 5
Figure 1 is the central result of the article. Under the official tables, the ten centred event biases span more than 220 points, from -114.44 in the 1500 metres to +105.89 in the 110 metres hurdles. FDM-40N compresses the same spread to 16.60 points, while FDM-40C produces 17.11 points.
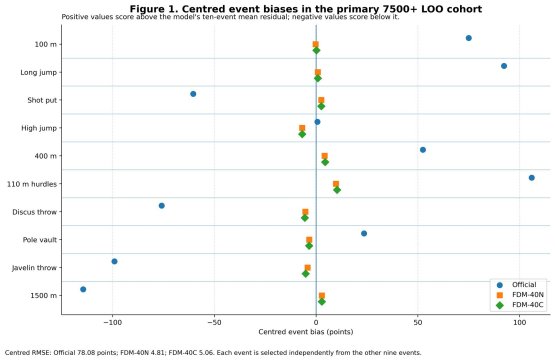
Figure 1. Centred event biases in the primary 7500+ leave-one-event-out cohort. Positive values score above the model's common ten-event residual; negative values score below it.
How to read the balance metrics
The three summary measures below describe how far the ten events remain from their shared level after centring. The intuition comes first; the formal names follow from it.
MAE asks how far, on average, each event lies from the common level, without allowing positive and negative values to cancel. The sign must be ignored: +100 and -100 have an ordinary mean of zero, although both events are badly displaced. MAE is the Mean Absolute Error of the ten centred event biases.
RMSE measures the same problem but gives extra weight to the largest displacements. A model with one or two events far from the rest is therefore penalised more strongly. RMSE is the Root Mean Squared Error of the centred event biases.
Bias spread is the distance between the highest and lowest centred event biases. It shows the total width of the event imbalance.
MAE = mean of |centred event bias|
RMSE = square root of the mean of the squared centred event biases
Bias spread = maximum centred bias - minimum centred bias
Table 3. Model-level balance metrics in the pooled 7500+ cohort
|
Model |
Centred MAE |
Centred RMSE |
Bias spread |
RMSE reduction vs OFF |
|
Official |
69.95 |
78.08 |
220.34 |
- |
|
FDM-40N |
4.01 |
4.81 |
16.60 |
93.84% |
|
FDM-40C |
4.20 |
5.06 |
17.11 |
93.52% |
|
Interpretation The primary result is not that FDM makes every event identical. It is that the systematic between-event displacement visible under the official tables is reduced by approximately 94%, while the natural and constrained FDM versions remain almost indistinguishable. |
6. The result persists across performance levels
A pooled statistic could conceal a model that works in one part of the range and fails in another. Figure 2 therefore separates the 7500+ population into three disjoint bands.
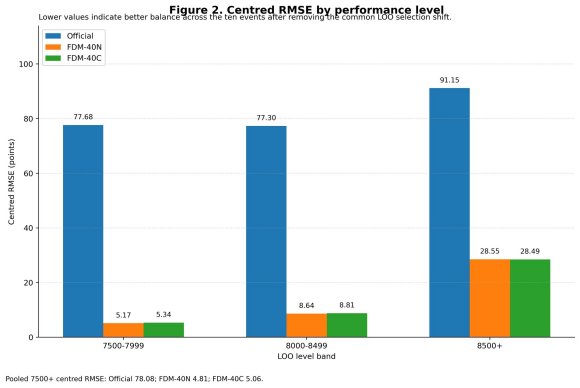
Figure 2. Centred RMSE by performance level. Lower values indicate better balance across the ten events after removal of the common LOO selection shift.
Table 4. Centred RMSE and sample size by primary OFF leave-one-event-out level
|
LOO level band |
Athlete-event observations |
Official |
FDM-40N |
FDM-40C |
|
7500-7999 |
37,841 |
77.68 |
5.17 |
5.34 |
|
8000-8499 |
12,582 |
77.30 |
8.64 |
8.81 |
|
8500+ |
2,010 |
91.15 |
28.55 |
28.49 |
|
7500+ pooled |
52,433 |
78.08 |
4.81 |
5.06 |
Because each event defines its own LOO cohort, the sample-size column reports athlete-event observations summed across the ten events rather than a single count of unique decathlon performances.
The FDM advantage is therefore not produced by a single band. In both 7500-7999 and 8000-8499, centred RMSE remains below nine points. At 8500+, the FDM centred RMSE rises to approximately 28.5 points, but the official value rises even further to 91.15.
The top band is smaller and contains more specialised athlete profiles. Its remaining deviations appear structured rather than purely random. They point towards several genuine structural features of elite decathlon, especially the increasing importance of the long jump, the flattening of high-jump performance and the tactical nature of the 1500 metres.
7. Event-by-event structure
The official pattern in Figure 1 is highly systematic. The speed and hurdle events sit above the common level, while the throws and 1500 metres sit below it. FDM largely removes this division.
Table 5. Centred event biases in the pooled 7500+ cohort
|
Event |
Official |
FDM-40N |
FDM-40C |
|
100 m |
74.96 |
-0.27 |
0.15 |
|
Long jump |
92.28 |
0.84 |
0.83 |
|
Shot put |
-60.37 |
2.54 |
2.52 |
|
High jump |
0.64 |
-6.85 |
-6.86 |
|
400 m |
52.48 |
4.13 |
4.45 |
|
110 m hurdles |
105.89 |
9.75 |
10.25 |
|
Discus throw |
-75.90 |
-5.27 |
-5.54 |
|
Pole vault |
23.53 |
-3.42 |
-3.43 |
|
Javelin throw |
-99.06 |
-4.24 |
-5.16 |
|
1500 m |
-114.44 |
2.79 |
2.79 |
7.1 Speed and hurdles
The 100 metres, 400 metres and 110 metres hurdles are all placed high by the official tables. The centred official biases are +74.96, +52.48 and +105.89 points respectively. The hurdles show the largest positive displacement of any event.
FDM-40N reduces these values to -0.27, +4.13 and +9.75 points. The constrained model follows almost exactly. This confirms the two-part diagnosis already visible in the calibration work: the official nominal levels of the sprint and hurdle events are high, while the official curves appear too flat at higher performance levels.
7.2 Throws
The shot put, discus and javelin occupy the opposite side of the official scale at -60.37, -75.90 and -99.06 points. The javelin is the largest negative displacement after the 1500 metres.
Under FDM-40N the three throwing biases become +2.54, -5.27 and -4.24 points. The natural exponents below 1 in discus and javelin do not produce an elite imbalance; FDM-40C, which constrains those exponents above 1, remains nearly identical in the tested range.
7.3 High jump and pole vault
The official high jump is close to the common mean in the pooled 7500+ range, with a centred bias of only +0.64 points. Pole vault sits moderately high at +23.53. FDM shifts both somewhat below the mean, to -6.85 and -3.42.
These are much smaller corrections than those required for the hurdles, javelin or 1500 metres. High jump, however, becomes especially interesting at the absolute top because the observed mark stops rising while the overall decathlon level continues to increase.
7.4 Long jump and 1500 metres
Long jump and 1500 metres are the two events for which a single global label such as "overvalued" or "undervalued" is least satisfactory. Long jump has a large positive official bias, but the event also becomes increasingly characteristic of the absolute elite. The 1500 metres has the largest negative official bias, but the observed final-event time is influenced by fatigue, tactical requirements and the standings after nine events.
8. The anatomy of elite decathlon
Figure 3 examines the observed official event scores in four narrower elite LOO bands. The bands are defined from the other nine events, so the tested event does not determine the athlete's level.
Because selection is event-specific, sample sizes differ by event. From the lowest to the highest band, the N values are: long jump 711, 264, 90 and 12; high jump 881, 366, 145 and 56; 1500 metres 1,060, 572, 226 and 129.
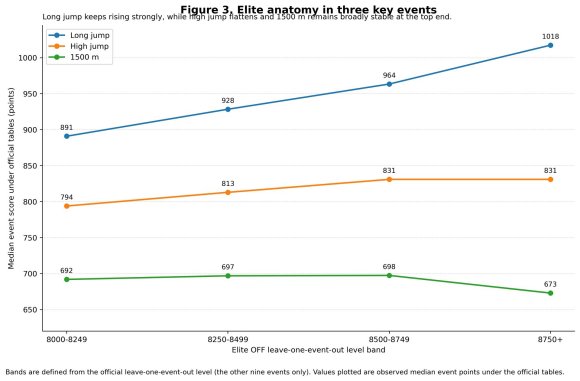
Figure 3. Observed median official scores in the long jump, high jump and 1500 metres across four elite leave-one-event-out level bands.
8.1 Long jump keeps rising
Median long-jump points rise from 891 in the 8000-8249 band to 928.5, 963.5 and 1017.5 in the successive elite bands. The median raw mark rises from 7.32 metres to 7.83 metres.
This pattern helps explain why long jump remains the largest positive residual under FDM at the very top. It is not merely a defect of the revised table. Long jump genuinely distinguishes the absolute elite more strongly than it distinguishes athletes in the bands immediately below.
8.2 High jump reaches a plateau
Median high-jump points rise from 794 to 813 and then to 831, but remain at 831 in the 8750+ band. The median mark is 2.03 metres in both of the two highest groups, even though the median ten-event equivalent level continues to rise.
High jump remains important, but it does not continue to scale with total performance at the same rate as long jump. This is why the event becomes increasingly negative relative to the nine-event expectation at the top.
8.3 The 1500 metres is a special case
The 1500-metre median remains around 692-698 points through the first three elite groups and then falls to 673 points in the 8750+ band. The corresponding median times are approximately 4:38.20, 4:37.42, 4:37.28 and 4:41.19.
Richard Crawford identified the same high-end plateau in his 2018 analysis: the official median was 708 points in both the 8000-8249 and 8250+ groups. He proposed an end-of-competition explanation. Athletes with no realistic path to the podium, athletes defending a secure position and athletes chasing a record face different incentives in the final event.
The present LOO analysis finds the same pattern using an event-independent definition of athlete level. An observed 1500-metre time may represent maximum ability, accumulated fatigue, tactical necessity or merely the performance required to protect the final standing. The event therefore cannot be interpreted as cleanly as a first-day sprint or a throw.
9. Two practical athlete profiles
The preceding sections are statistical. Two individual examples help translate the same logic into recognisable decathlon profiles. They are illustrations, not substitutes for the full database.
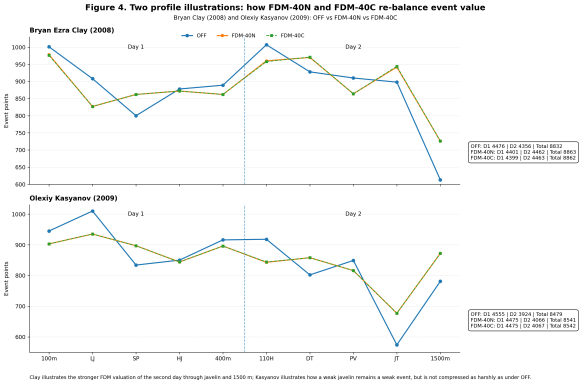
Figure 4. Event-by-event points for Bryan Clay's 2008 performance and Olexiy Kasyanov's 2009 performance under OFF, FDM-40N and FDM-40C.
Table 6. Day totals and overall totals in the two profile examples
|
Athlete |
Model |
Day 1 |
Day 2 |
Total |
D2 - D1 |
|
Bryan Clay 2008 |
OFF |
4476 |
4356 |
8832 |
-120 |
|
|
FDM-40N |
4401 |
4462 |
8863 |
+61 |
|
|
FDM-40C |
4399 |
4463 |
8862 |
+64 |
|
Olexiy Kasyanov 2009 |
OFF |
4555 |
3924 |
8479 |
-631 |
|
|
FDM-40N |
4475 |
4066 |
8541 |
-409 |
|
|
FDM-40C |
4475 |
4067 |
8542 |
-408 |
9.1 Bryan Clay: an apparently first-day-dominant performance
Under the official tables, Clay's 8832-point performance in Eugene is presented as 4476 points on Day 1 and 4356 on Day 2, a 120-point first-day advantage. FDM-40N changes the interpretation to 4401 and 4462. The second day becomes 61 points stronger, while the total rises by only 31 points.
The redistribution is not caused by one event alone. Clay is awarded fewer points in the 100 metres, long jump, 400 metres, hurdles and pole vault, while gaining points in the throws and the 1500 metres. His 4:50.97 remains a weak final-event performance, but the official tables do not allow the strength of his throwing profile to compensate proportionately.
9.2 Olexiy Kasyanov: still a weak second day
Kasyanov provides the necessary counterexample. His Berlin 2009 performance contains an outstanding first day and a genuinely weaker second day. FDM does not mechanically force the two days towards equality.
The official difference is 631 points; FDM-40N reduces it to 409 points, but Day 2 remains clearly inferior. His 49.00-metre javelin score rises from 574 official points to 677 under FDM-40N, yet it remains his only event below 700 points. A large positive correction relative to OFF is therefore not the same as a high absolute score.
|
What the examples show FDM does not contain a hidden rule that both days should be equal. It changes the event scales. When a profile is genuinely balanced, the two days may become closer; when the second day is genuinely weak, the difference remains. |
10. Relation to Richard Crawford's analysis
Crawford's 2018 paper and the present LOO analysis ask related but different questions. Crawford grouped complete decathlon performances by their full official total and compared percentile movements after normalising each event distribution around its median. The present method defines athlete level independently of the event under test and focuses on the nominal balance of event contributions.
Crawford's point-range cohorts therefore include the event currently being analysed, whereas LOO defines level from the other nine. Despite this methodological difference, several broad conclusions converge:
- the 1500 metres behaves as a special final event and reaches a clear plateau at high levels;
- the hurdles and 400 metres require stronger differentiation at upper levels;
- the relationship between event value and total level is not constant across the whole population;
- a complete lower-level test is necessary before any elite-derived table can be claimed to work universally.
Where the present results support Crawford's conclusions, the agreement should be acknowledged directly. His explanation of the 1500-metre plateau is strongly supported by the present cohort results. His emphasis on complete ten-event performances and on testing different performance levels also materially improved the FDM validation design.
11. A first look below 6,800 points
The present database cannot provide an unbiased LOO validation below its source boundary. Crawford's published cohort medians nevertheless offer a preliminary view of the lower scale.
Table 7. Crawford cohort medians rescored under FDM-40N
|
Official cohort |
Sum of OFF event medians |
Same median marks under FDM-40N |
Difference |
|
4000-4249 |
4073 |
4052 |
-21 |
|
5000-5249 |
5113 |
5087 |
-26 |
|
6000-6249 |
6124 |
6109 |
-15 |
|
7000-7249 |
7114 |
7106 |
-8 |
|
8000-8249 |
8102 |
8097 |
-5 |
The preliminary result is striking. FDM-40N substantially redistributes points among the ten events, yet the combined median scale remains almost unchanged from approximately 4,000 to 8,250 points.
This does not prove individual fairness. A sum of ten medians is not a real athlete, and the raw marks were reconstructed approximately from truncated official points. The medians cannot show whether gains and losses occur within the same athletes, whether particular profiles are systematically favoured or how wide the individual distribution becomes.
The next lower-level question
The cohort medians remain remarkably stable, but only individual-level data can show who gains, who loses and whether those changes are structurally justified.
12. Limitations
- The source population begins at approximately 6,800 official points. Results below 7,500 are affected by truncation and are not treated as primary evidence.
- LOO centring removes a common selection shift, but it does not make residual observations independent. Repeated performances by the same athletes remain clustered.
- The 8500+ cohorts are much smaller and contain stronger profile specialisation, so event estimates are less stable than in the larger bands.
- The two athlete profiles are explanatory illustrations only; they do not add statistical weight to the full-sample result.
- The Crawford median reconstruction is a preliminary indication rather than a substitute for individual data from lower-scoring performances.
Most importantly, the coefficients remain frozen. No formula was adjusted after seeing the LOO result. The purpose of the test was to evaluate the published FDM-40N and FDM-40C models, not to optimise them against a new metric.
13. Conclusion
The leave-one-event-out test changes the evidential status of FDM. The model is no longer supported only because representative reference performances align or because selected elite totals appear plausible. It has now been evaluated across the frozen database of 17,277 complete decathlon performances, with the principal inference restricted to the clean 7500+ range.
Under the official tables, the ten events remain separated by a strong structural pattern: the sprints, hurdles and long jump sit high, while the throws and 1500 metres sit low. In the clean pooled 7500+ range, the centred RMSE is 78.08 points and the event spread exceeds 220 points. FDM-40N reduces them to 4.81 and 16.60 points, respectively. FDM-40C produces almost the same result.
The remaining deviations are informative. Long jump becomes increasingly characteristic of the absolute elite. High jump reaches a plateau. The 1500 metres is partly a measure of ability and partly a record of the competitive situation after nine events. FDM does not erase these sporting structures; it reveals them after the larger scoring distortions have been removed.
The strongest present conclusion is therefore not that FDM has made the ten events identical. It is that the large systematic imbalance of the official tables can be reduced by approximately 94% without destroying the familiar total scale or the genuine diversity of athlete profiles.
The next test belongs lower down the pyramid. Crawford's medians suggest that the total scale remains stable, but only individual lower-level performances can show whether that stability holds for each athlete rather than merely for the average cohort. This individual-level validation of lower-scoring performances is the subject of Part V.
References
Crawford, Richard (2018). Are the Decathlon Tables Fair? Research manuscript dated 3 June 2018, hosted by Decathlon2000.com.
IAAF (2001). Scoring Tables for Combined Events. 2001 edition.
Decathlon2000.com. Annual men's decathlon world lists, seasons 1985-2019 and 2021-2025. Accessed July 2026.
Salmistu, Janek (2026). A New Perspective on Decathlon Scoring: Richard Crawford's 2018 Research. Decathlon2000.com.
Snoch, Rafal (2026). Fair Decathlon Model, Parts I-III. Decathlon2000.com.