
Fair Decathlon Model. Part 5: How Far Down Does FDM Continue to Balance the Ten Events? (0)
|
Principal finding Using the same leave-one-event-out method and the same frozen equations as Part IV, FDM-40N reduces centred RMSE by 74% at 7000-7249, 63% at 6500-6749 and 61% at 6000-6249. The reduction then falls to 43%, 20% and 6%, before reversing at 4000-4249. The deterioration is not uniform: the ten events open into different residual trajectories, with the 110 m hurdles and 1500 m producing the largest opposing movements at the bottom. |
1. The question left by Part IV
Part IV tested whether the ten events made comparable contributions when athlete level was estimated independently of the event under examination. In the clean 7500+ range, the official tables left a large and systematic between-event fingerprint. FDM-40N reduced centred RMSE from 78.08 to 4.81 points, while the constrained control model FDM-40C produced 5.06 points.
That result could not be extended cleanly below 7500 because the Part IV source database began near 6800 official points. Near a lower source boundary, leave-one-event-out selection becomes asymmetric: an athlete may enter the source only because the event being omitted was strong enough to lift the full total above the admission line.
Part V repeats the same test on the expanded lower-level population. The question is no longer whether FDM balances the upper decathlon range. It is how far down the frozen geometry continues to remove the official-table fingerprint, and how the remaining event structure changes as the level falls.
The method is unchanged. Only the population is new.
FDM-40N and FDM-40C remain frozen. No coefficient was fitted or adjusted to the lower results. The expanded database is used to test the models, not to retune them.
2. One expanded master, two sampling frames
FDM-40N and FDM-40C were calibrated from 17,277 complete performances drawn from annual world lists that began at approximately 6800 official points. The later collection was designed specifically to find complete performances below 7000. After auditing and deduplication, both parts were joined into a unified master.
The database no longer ends near the conventional lower boundary of international statistics. It now contains 27,741 complete decathlons, extending from Kevin Mayer's 9,126-point world record to Thomas Vilding's fully documented 1,314-point performance. Reaching that lower end required not merely collecting totals, but verifying all ten raw marks and, wherever necessary, the hurdle heights and implement weights used.
The new master is much larger, but its coverage is not equally dense across the whole scoring scale. The older source is concentrated above its former boundary, while lower results were collected from a wider mixture of national lists, meet protocols and annual World Athletics lists. Availability differs between seasons, countries and performance levels. The combined file therefore contains a visible seam near the former 6800-point boundary.
In a leave-one-event-out test, this seam appears below the original full-total boundary. An athlete whose complete decathlon exceeds 6800 may fall into the 6500-6749 LOO cohort when one particularly strong event is removed. The full unified sample therefore contains too many athletes in that band who came from the old upper database precisely because the omitted event was unusually strong. They are valid decathlon results, but they do not form an ordinary sample of the 6500 level.
The solution is simple. The full master is used for the 7000-7249 boundary cohort, where data are needed on both sides of the lower database admission line. Below 7000, the analysis uses the 10,709 unique lower-derived performances identified inside the same master. The model is unchanged; only the sampling frame is adjusted where the old source boundary would otherwise distort the cohort.
Table 1. Why the 6500-6749 cohort uses the lower-derived FDM sample
|
Event |
Crawford Median |
Full FDM Median |
Difference |
Lower-derived FDM Median |
Difference |
|
100 m |
757 |
789 |
+32 |
761 |
+4 |
|
Long jump |
720 |
755 |
+35 |
725 |
+5 |
|
Shot put |
599 |
585 |
-14 |
583 |
-16 |
|
High jump |
679 |
687 |
+8 |
670 |
-9 |
|
400 m |
735 |
762 |
+27 |
735 |
+0 |
|
110 m hurdles |
758 |
790 |
+32 |
760 |
+2 |
|
Discus throw |
568 |
558 |
-10 |
557 |
-11 |
|
Pole vault |
645 |
659 |
+14 |
645 |
+0 |
|
Javelin throw |
556 |
549 |
-7 |
546 |
-10 |
|
1500 m |
613 |
622 |
+9 |
615 |
+2 |
|
Mean absolute difference |
|
|
18.8 |
|
5.9 |
FDM Median means the median official event score in the selected FDM database cohort; it is not a median calculated with the FDM-40N formula. Crawford grouped performances by full official total, whereas the present cohorts are selected separately for each event by OFF LOO level. Exact equality is therefore neither expected nor required.
The pattern is nevertheless clear. In the full sample, the 100 m, long jump, 400 m and hurdles medians are 27-35 points above Crawford. In the lower-derived sample, the same four differences fall to 0-5 points. The mean absolute difference falls from 18.8 to 5.9 points per event. This is why the lower-derived sample is used below 7000.
3. Leave-one-event-out method
For each athlete, event and scoring model, the event under examination is removed. The remaining nine events estimate the athlete's level. The omitted event is then compared with the average contribution implied by those nine.
Table 2. Core leave-one-event-out quantities
|
Quantity |
Definition |
Interpretation |
|
Nine |
Total - Event |
Points from the other nine events |
|
Expected |
Nine / 9 |
Average point contribution implied by the other nine |
|
Level |
Nine x 10 / 9 |
Ten-event equivalent of the nine-event performance |
|
Residual |
Event - Expected |
How far the omitted event lies above or below expectation |
Cohorts are selected separately for each event by OFF LOO Level. The same raw performances are then scored under OFF, FDM-40N and FDM-40C. This keeps the athlete sample identical across the three systems.
Why the residuals are centred
LOO selection creates a common shift because the other nine events determine cohort membership while the omitted event does not. The relevant comparison is therefore not the absolute mean residual of an event, but its position relative to the common mean residual of all ten events in the same model and band:
Centred event bias = event mean residual - common ten-event mean residual
Centring removes only the shared selection shift. It does not force real athlete profiles to become flat, and a centred residual should not automatically be read as pure scoring-function error.
4. Are the lower cohorts representative enough?
Richard Crawford grouped 63,576 complete performances by full official total and published the median official score in every event. His cohorts are not identical to event-specific LOO cohorts, but they provide a large independent check on whether the present samples occupy a plausible part of the decathlon population.
Table 3. Representativeness audit against Crawford medians
|
OFF LOO cohort |
Primary FDM sample |
Event N range |
Mean |median difference| |
|
7000-7249 |
Full FDM |
3955-5134 |
9.0 |
|
6500-6749 |
Lower-derived FDM |
1583-2073 |
5.9 |
|
6000-6249 |
Lower-derived FDM |
884-1035 |
15.5 |
|
5500-5749 |
Lower-derived FDM |
654-860 |
9.4 |
|
5000-5249 |
Lower-derived FDM |
424-538 |
9.9 |
|
4500-4749 |
Lower-derived FDM |
401-504 |
12.3 |
|
4000-4249 |
Lower-derived FDM |
320-371 |
21.8 |
Agreement is strongest at 7000 and 6500 and remains generally close through 4500. The 6000-6249 cohort shows a somewhat larger mean difference, driven mainly by the 100 m and hurdles, while the lowest 4000-4249 cohort differs by 21.8 points per event on average. The broad event pattern remains recognisable, but the extreme bottom should be interpreted with greater caution.
This table is a representativeness audit, not a calibration target. Crawford selected athletes by full total; the present analysis selects them by the other nine events. Agreement is useful evidence that the samples are plausible, but exact equality is neither expected nor required. The complete event-by-event comparison appears in the separate appendix.
5. Headline result: strong balance at first, then a steady opening
Figure 1 follows centred RMSE across seven consecutive 250-point bands. The official-table result remains high throughout the range, fluctuating between approximately 78 and 89 points. FDM-40N begins near 20 points at 7000-7249 and then rises steadily as the level falls.
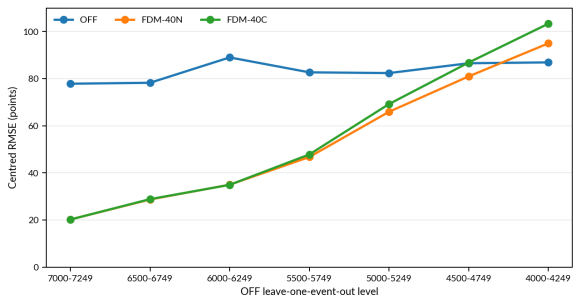
Figure 1. Whole-model centred RMSE from 7000-7249 to 4000-4249. Cohorts are selected by OFF LOO Level; the same athletes are scored under all three systems.
Table 4. Whole-model centred RMSE across the lower range
|
Cohort |
OFF RMSE |
FDM-40N RMSE |
FDM-40C RMSE |
FDM-40N reduction |
|
7000-7249 |
78 |
20 |
20 |
74% |
|
6500-6749 |
78 |
29 |
29 |
63% |
|
6000-6249 |
89 |
35 |
35 |
61% |
|
5500-5749 |
83 |
47 |
48 |
43% |
|
5000-5249 |
82 |
66 |
69 |
20% |
|
4500-4749 |
87 |
81 |
87 |
6% |
|
4000-4249 |
87 |
95 |
103 |
-9% |
The transition is continuous rather than abrupt. FDM-40N reduces RMSE by 74% at 7000, 63% at 6500 and 61% at 6000. The reduction then falls to 43% at 5500, 20% at 5000 and 6% at 4500. At 4000, the whole-model RMSE is 9% higher than OFF.
FDM-40C is almost indistinguishable from FDM-40N through 6000. It then weakens slightly faster, reaching 103 points at the bottom compared with 95 for FDM-40N. Both models tell the same broad story: the lower residual structure grows with every step into the basement.
6. Day One: five quieter, but different, trajectories
Whole-model RMSE compresses ten event directions into one number. Figure 2 separates the five events of the first day. The shared vertical scale is deliberately retained for Figure 3, so the relative calm of Day One is visible rather than magnified by a narrower axis.
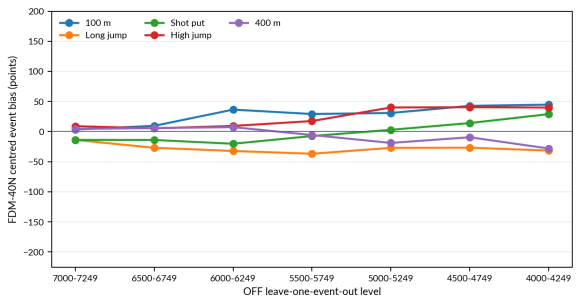
Figure 2. FDM-40N centred event-bias trajectories for Day One. All values use the same vertical scale as the Day Two figure.
At 7000-7249, all five Day One events lie within 14 points of the model centre. Their paths then separate. The 100 m moves upward, long jump remains moderately negative, shot put moves from negative to positive, high jump remains positive, and the 400 m turns downward in the lower cohorts.
The important result is not that Day One can be described by one common label. It cannot. Even within the quieter half of the decathlon, the five events do not deteriorate by the same amount or in the same direction.
7. Day Two: the residual fan opens
Figure 3 uses exactly the same vertical scale. The contrast is immediate. The second-day events create most of the growing whole-model divergence.
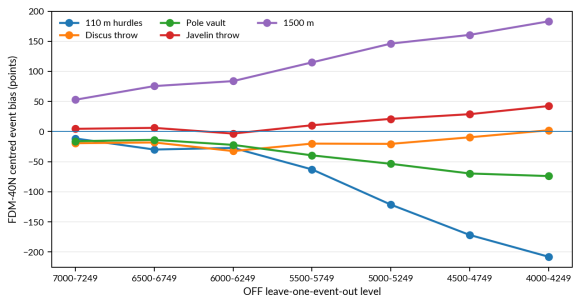
Figure 3. FDM-40N centred event-bias trajectories for Day Two. The scale is identical to Figure 2.
The 1500 m is already separated at 7000-7249 (+53 points) and 6500-6749 (+76). It then rises steadily, reaching +183 points at 4000-4249. The 110 m hurdles move in the opposite direction, from -11 at 7000 to -208 at 4000. Pole vault also moves downward, but on a different trajectory. Discus and javelin remain much closer to the centre before separating lower down.
|
Sensitivity checks If the 1500 m is removed and the remaining nine events are re-centred, FDM-40N RMSE falls from 20.2 to 10.4 points at 7000-7249 and from 28.7 to 14.4 at 6500-6749. The corresponding reductions versus OFF become 86.8% and 82.1%. At 4000-4249, removing both the 110 m hurdles and 1500 m and re-centring the remaining eight events reduces FDM-40N RMSE from 95.0 to 40.9 points, compared with 92.3 for OFF. The FDM reduction is then 55.7%. This does not erase the lower-range problem, but it shows how strongly two opposing event paths dominate the ten-event headline statistic. |
8. What the whole-model result does - and does not - mean
The lower-range test produces two results at the same time. First, FDM continues to remove most of the broad official-table fingerprint at 7000, 6500 and 6000. Second, the remaining FDM residuals do not grow as one uniform model error. They open into ten event-specific trajectories.
This distinction matters at the bottom. At 4000-4249, the whole-model RMSE of FDM-40N is worse than OFF. It would be misleading to describe that result simply as the entire FDM geometry collapsing. Some events remain comparatively close to the model centre, while the hurdles and 1500 m have moved more than 180 or 200 points away in opposite directions.
Part V therefore answers the descriptive question: what happens as the level falls? The answer is that the official fingerprint is strongly reduced at first, but the ten residual paths then diverge in different directions and at different speeds.
9. The question for Part VI
Why do the ten event trajectories diverge so differently? Does the lower residual fan mean that the frozen FDM functions themselves are wrong at lower levels? Or do the residuals also contain something about the structure of the decathlon population? Part VI will examine the ten events one by one, using raw-performance cohorts and individual profiles. Its task will be to interpret the differences measured here - not to assume the answer in advance.
For now, the central conclusion is deliberately limited: FDM does not simply become worse by the same amount in every event. It changes differently in each of them.
|
Conclusion The same leave-one-event-out method that reduced centred imbalance by approximately 94% in the clean 7500+ range still produces a large improvement at 7000-6000. That improvement weakens continuously below 6000 and disappears at the extreme bottom of the present test. The event charts show why a single RMSE number is not enough: the lower decathlon does not form one common residual curve. It forms ten. |
References and data
[1] Snoch, R. Fair Decathlon Model, Part III: Forty Seasons, Cleaner Data, and Wider Calibration. July 2026.
[2] Snoch, R. Fair Decathlon Model, Part IV: Does FDM Balance the Ten Events? July 2026.
[3] Crawford, R. Are the Decathlon Tables Fair? 2018. Source of the independent full-total cohort medians.
[4] FDM unified master: 27,741 complete performances.
[5] FDM lower-derived subset: 10,709 unique complete performances represented in the unified master by a populated LowerRawID field.
Reproducibility note. Event scores were truncated to integers before totals and LOO calculations. Cohorts were selected by OFF LOO Level. The full unified master was used for 7000-7249; below 7000, the lower-derived subset was selected within the same master by requiring LowerRawID to be populated. FDM-40N and FDM-40C remained frozen. Displayed means, medians and headline metrics are rounded for communication; calculations retain full precision.
APPENDIX TO FAIR DECATHLON MODEL - PART 5
Official event-score medians in seven lower leave-one-event-out bands