
Fair Decathlon Model. Part 1: Are the Current Decathlon Scoring Tables Properly Balanced? (6)
An Introduction to the Fair Decathlon Model
I have been asking myself this question for more than twenty years, ever since I became interested in the decathlon as a teenager at the beginning of the twenty-first century.
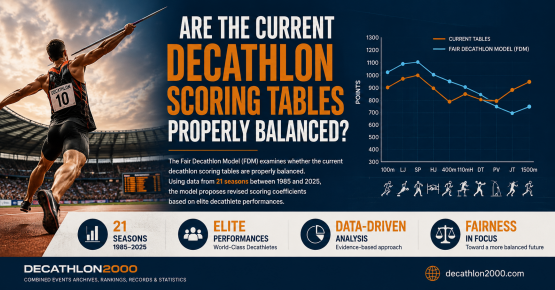
At first, the scoring system seemed almost like black magic to me. While watching competitions on television, I would hear that the tables were nonlinear, or that ten centimetres in the long jump were worth approximately 25 points. I did not yet understand the formulas, but I was fascinated by the structure of the competition itself: ten different events contested over two days, a constantly changing leaderboard, and the question of whether points lost in the shot put could later be recovered in the high jump, the hurdles or the javelin.
Only after I received my first computer, gained access to the internet and began using spreadsheets could I start analysing the tables myself. However, as I learned more about the formulas and carried out my first calculations, another question emerged: was the scoring system truly fair?
Or, to put it more precisely: was it properly balanced across all ten events?
Could an athlete gain a relatively larger advantage in one event than in another? Could someone progress through eight events without doing anything exceptional and then recover almost every lost point with two outstanding performances? Conversely, could one poor event negate the work completed in the other nine?
Over time, an even more fundamental question appeared: should the performances of combined-events athletes be evaluated primarily in relation to specialist standards, or should decathletes be compared with other decathletes?
As I followed more competitions, I began to suspect that the relationship between decathlon scoring and specialist-level performances might distort the balance between events. Scoring 1,000 points appeared considerably more accessible in the long jump or pole vault than in the shot put or 1,500 metres.
An impression, however, is not evidence. I needed a method that could show what the data actually said.
What Does a Balanced Scoring System Mean?
The Fair Decathlon Model, or FDM, is based on one simple principle:
Performances of comparable exceptional quality among decathletes should receive comparable rewards, regardless of the event in which they are achieved.
This does not mean that every event should be equally easy or equally difficult. Nor does it mean that every athlete should have a similar performance profile.
Specialisation is a natural part of the decathlon. Athletes should be able to build an advantage in their strongest events while limiting their losses in weaker ones. The question is whether a comparable sporting advantage produces a comparable scoring advantage in each of the ten events.
A decathlon should be won through the complete set of ten performances. One or two outstanding events may provide a major advantage, but they should not automatically cancel everything that happened in the other eight or nine.
From Intuition to Data
I am generally a fan of combined events. During the winter I follow Nordic combined and biathlon, and I am also interested in modern pentathlon. In many combined-event formats, the conversion between performance and score is linear. The decathlon, with its progressive and nonlinear scoring system, presents a very different analytical challenge.
To evaluate the balance of the official tables, I turned to the annual world lists.
After several trials, I concluded that the Top 150 from each season provided a sufficiently broad range of performance levels: from the world elite, through high-level international athletes, to the lower part of the analysed group.
For each event and season, I selected:
- the 10th-best performance,
- the 75th-best performance,
- the 140th-best performance.
At the current stage, the analysis covers 21 selected seasons between 1985 and 2025. The seasons included were 1985, 1990, 1995, 1997-2002, 2004, 2006, 2009-2010, 2012, 2014-2015, 2017-2018, 2021, 2024 and 2025. Despite the four-
decade span, changing generations of athletes and developments in training and equipment, the average performance levels at these positions proved surprisingly consistent.
I then calculated the average 10th, 75th and 140th performances across all analysed seasons and converted them using the current official scoring tables.
The average point values across all ten events were:
|
Performance level |
Average score under the official tables |
|
10th-best performance |
885 |
|
75th-best performance |
779 |
|
140th-best performance |
676 |
The first two values became the calibration anchors of FDM. The third was retained as an independent validation point.
Why 885 and 779 Points?
The purpose of FDM is not to create an entirely new scoring scale. The aim is to correct the balance between events while preserving the numerical language already understood by the combined-events community.
A score of 9,000 points should continue to represent an extraordinary achievement. Approximately 8,500 points should still indicate world-class level, while 8,000 points should remain an important and recognisable performance threshold.
Mathematically, it would be possible to construct a system in which the world's best decathletes scored 7,000 or 12,000 points. Such a change would provide no practical benefit, while removing the historical and intuitive meaning of familiar totals.
FDM therefore does not attempt to change what an overall score means. It attempts only to redistribute its value more evenly across the ten events.
Under the official tables, the average scores at the 10th- and 75th-best performance levels differed by 106 points. Under FDM, the same difference in position within the world decathlon population should therefore receive the same point value in every event.
For example:
- in the 100 metres, the average 10th-best performance was 10.68 and the average 75th-best performance was 11.06;
- in the shot put, the corresponding results were 15.49 and 13.94.
This does not mean that 0.38 seconds in the 100 metres is objectively equivalent to 1.55 metres in the shot put. It means only that both differences represent movement from the 75th to the 10th performance level among decathletes.
Calculating the New Coefficients
FDM retains the standard structure of the official scoring formulas:
Running events: P = A(B - T)C
Field events: P = A(M - B)C
The model therefore does not replace the existing scoring system with a fundamentally different one. It adjusts the coefficients in order to achieve a better balance between the ten events.
The existing values of coefficient B, representing the zero-point baseline in each event, are retained. New values of A and C were calculated so that:
- the average 10th-best performance in every event scores exactly 885 points;
- the average 75th-best performance scores exactly 779 points.
Once the existing value of B is retained, these two conditions uniquely determine the new values of A and C.
The average 140th-best performance was not used to calculate the coefficients. It was retained as an independent validation point.
FDM Coefficients
|
Event |
A |
B |
C |
|
100 m |
7.556558 |
18 |
2.393274 |
|
Long jump |
0.042891 |
220 |
1.578727 |
|
Shot put |
50.398209 |
1.5 |
1.086491 |
|
High jump |
1.134318 |
75 |
1.359877 |
|
400 m |
0.186173 |
82 |
2.401021 |
|
110 m hurdles |
0.515670 |
28.5 |
2.796351 |
|
Discus throw |
29.848187 |
4 |
0.895929 |
|
Pole vault |
1.025651 |
100 |
1.123834 |
|
Javelin throw |
40.688204 |
7 |
0.755619 |
|
1,500 m |
0.181305 |
480 |
1.578487 |
An Independent Validation Point
Because the 140th-best performance was not used to fit the model, it allows us to examine how the new functions behave beyond the two primary calibration points.
|
Event |
Avg. 10th |
FDM |
Avg. 75th |
FDM |
Avg. 140th |
FDM |
|
100 m |
10.68 |
885 |
11.06 |
779 |
11.44 |
681 |
|
Long jump |
7.61 |
885 |
7.19 |
779 |
6.77 |
678 |
|
Shot put |
15.49 |
885 |
13.94 |
779 |
12.26 |
665 |
|
High jump |
2.09 |
885 |
1.97 |
779 |
1.86 |
685 |
|
400 m |
47.99 |
885 |
49.75 |
779 |
51.71 |
670 |
|
110 m hurdles |
14.15 |
885 |
14.79 |
779 |
15.49 |
673 |
|
Discus throw |
48.00 |
885 |
42.16 |
779 |
36.90 |
682 |
|
Pole vault |
5.10 |
885 |
4.66 |
779 |
4.21 |
672 |
|
Javelin throw |
65.96 |
885 |
56.80 |
779 |
48.83 |
683 |
|
1,500 m |
4:22.73 |
885 |
4:39.60 |
779 |
5:00.49 |
655 |
|
Average |
|
885 |
|
779 |
|
674.4 |
At the 140th-performance level, FDM produces an average of 674.4 points, compared with the empirical value of approximately 676 points under the official tables. The scores for the individual events range from 655 to 685 points.
The model was not fitted to this performance level, yet it still preserves a very similar overall average.
What Does FDM Change?
In nominal terms, FDM generally awards:
- more points for the throwing events,
- fewer points for the jumping events,
- slightly fewer points for the running events.
However, this is only a general description. The actual change depends on the specific performance. An outstanding 400 metres or 1,500 metres may gain points compared with the official tables, while an exceptional javelin result does not necessarily receive more.
FDM does not attempt to favour a particular type of athlete. It attempts to evaluate each individual performance according to its level within the reality of the decathlon.
Does the Overall Scale Remain Familiar?
One of the most important tests was a synthetic decathlon composed of the best individual performances achieved in decathlons with final scores above 7,000 points.
Under the official tables, this combination is worth 10,685 points. Under FDM, it is worth 10,687 points.
|
Event |
Performance |
FDM |
Official |
|
100 m |
10.12 |
1056 |
1066 |
|
Long jump |
8.51 |
1129 |
1194 |
|
Shot put |
19.17 |
1141 |
1048 |
|
High jump |
2.28 |
1060 |
1071 |
|
400 m |
45.00 |
1084 |
1060 |
|
110 m hurdles |
13.36 |
1029 |
1059 |
|
Discus throw |
57.70 |
1058 |
1032 |
|
Pole vault |
5.76 |
1047 |
1152 |
|
Javelin throw |
79.80 |
1038 |
1040 |
|
1,500 m |
3:58.70 |
1045 |
963 |
|
Total |
|
10,687 |
10,685 |
The total changes by only two points, but the internal distribution of those points is clearly different.
FDM does not change the overall class of the performance. It changes the answer to the question of where its value comes from.
The Best Decathlons in History
Recalculating all personal bests above 8,900 points also produces neither radical inflation nor a collapse of the familiar scoring scale.
|
Athlete |
Official |
FDM |
Change |
New rank |
|
9126 |
9098 |
-28 |
3 |
|
|
9045 |
9150 |
+105 |
1 |
|
|
9026 |
9045 |
+19 |
4 |
|
|
9018 |
9122 |
+104 |
2 |
|
|
8994 |
9021 |
+27 |
5 |
|
|
8961 |
8966 |
+5 |
6 |
|
|
8909 |
8956 |
+47 |
7 |
|
|
8909 |
8918 |
+9 |
8 |
The 9,000-point threshold remains extremely difficult to reach. The order of some athletes changes, but the general scale of their performances does not.
Limitations of the Model
FDM is an empirically based model, but it is neither finished nor beyond criticism.
Its calibration is based on Top 150 world lists originally determined by the official scoring system. This may create a limited selection effect, because athletes with profiles treated less favourably by the current tables may have failed to enter the analysed group.
In an additional test using complete Top 250 lists from the 2004, 2009 and 2024 seasons, 442 of the 450 positions in the recalculated Top 150 remained occupied by the same athletes. This suggests that the selection effect is small, but it should not be treated as nonexistent.
The model should continue to be tested using:
- junior and lower-level competitions,
- unusual athlete profiles,
- performances far outside the calibration range,
- complete historical competitions from different eras.
What FDM Is Not
FDM is not an attempt to change historical medals or official results.
Nor does it mean that previous results were "unfair". Athletes competed under the rules in force at the time and adapted their preparation accordingly.
The model is not intended to punish particular athletes, training styles or performance profiles. It is also not presented as the only possible solution to the scoring problem.
Historical competitions serve as a laboratory for FDM. They allow us to test how the model behaves when applied to real combinations of performances, famous contests and very different types of decathletes.
The real question is not whether the past should be changed, but whether the future of the event could benefit from a different approach.
An Invitation to Discussion
Could the Fair Decathlon Model provide a relatively simple and elegant way to address scoring-balance problems that have been discussed within the combined-events community for many years?
I do not want to answer that question alone.
I am therefore publishing the assumptions, coefficients and first test results so that the decathlon community can evaluate them, challenge them and try to identify cases in which the model does not behave appropriately.
Suggestions of competitions, athletes and performance profiles that could provide the most difficult possible tests for FDM would be especially valuable.
The model may prove to be a promising alternative. Further analysis may instead reveal its limitations or lead to a better solution.
That is precisely what an open discussion should achieve.